What Is Term Structure of Interest Rates
The term structure of interest rates, also known as the yield curve, is a graphical representation that shows the relationship between the yields of bonds with different maturities (the time until the bond matures) at a specific point in time. This relationship can be visualized as a curve, with the maturity of the bond on the X-axis and the corresponding yield on the Y-axis.
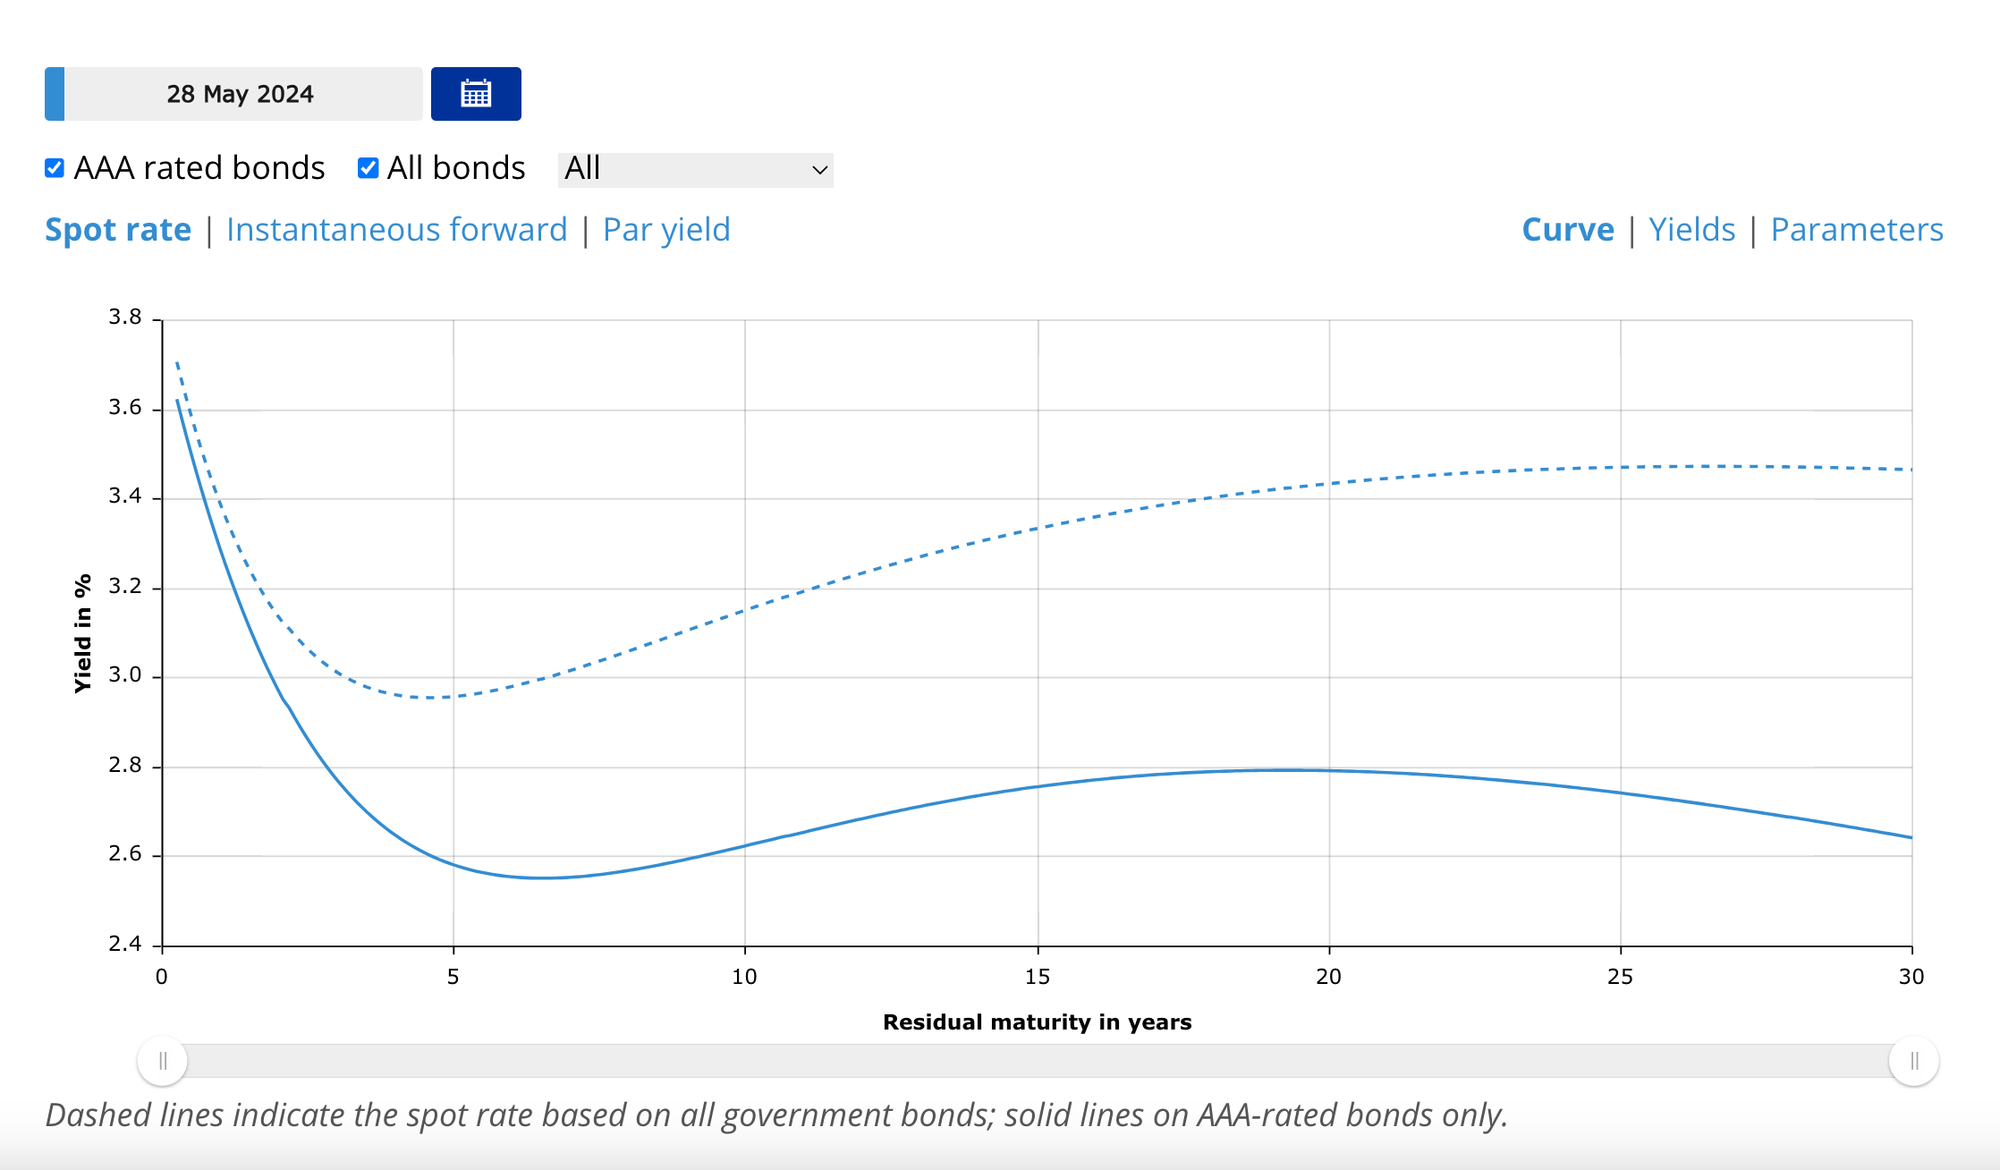
To illustrate this concept, consider the Euro area yield curves for AAA rated bonds and government bonds, shown in the table below. The table reveals the typical pattern of yields across different maturities, providing a snapshot of the market at a given moment.
There are three main types of yield curves:
- Normal yield curve: This is the most common type, sloping upward. It indicates that longer-term bonds offer higher yields than shorter-term bonds. This usually reflects a healthy economy where investors anticipate future economic growth and inflation.
- Inverted yield curve: In contrast, an inverted yield curve slopes downward, meaning longer-term bonds have lower yields than shorter-term bonds. This suggests investor concerns about a potential economic slowdown or deflation, and can often be a leading indicator of a recession.
- Flat yield curve: This occurs when the yield for bonds of different maturities are nearly the same. A flat curve can signal uncertainty in the market or a transition between a normal and inverted yield curve.
There are several factors influencing the shape of the yield curve:
- Inflation expectations: Higher inflation expectations tend to push yields higher, particularly for longer-term bonds.
- Economic growth expectations: When the economy is expected to grow, investors are more willing to hold longer-term bonds, driving down yields.
- Risk aversion: During periods of economic uncertainty, investors prefer shorter-term bonds, leading to lower yields for longer-term bonds.
- Monetary policy: The actions of central banks, such as the Federal Reserve, can influence the shape of the yield curve through their interest rate decisions.
The term structure of interest rates provides valuable information for investors and economists:
- Understanding investor expectations: The yield curve offers insights into market sentiment and future economic prospects, revealing investor optimism or pessimism.
- Investment decisions: Investors use the yield curve to make informed decisions about which bonds to invest in, taking into account risk and potential returns.
- Policy decisions: Central banks closely monitor the yield curve to gauge economic health and guide their monetary policy decisions, adjusting interest rates to achieve their desired economic outcomes.
How Do Changes in the Term Structure of Interest Rates Affect the Economy
Changes in the term structure of interest rates, represented by shifts in the yield curve, can significantly impact the economy through various channels:
- Impact on Borrowing Costs: A steepening yield curve (long-term rates rising faster than short-term rates) increases borrowing costs for businesses and households seeking long-term financing like mortgages or loans. This can dampen investment and big-ticket spending. A flattening or inverting yield curve (long-term rates falling relative to short-term rates) reduces borrowing costs, potentially stimulating investment, housing market activity, and consumer spending on durables.
- Signaling Future Economic Conditions: The yield curve shape reflects market expectations about future interest rates, inflation, and economic growth. An inverted curve has historically signaled an impending economic slowdown or recession, as it implies tighter monetary policy ahead to control inflation. A steepening curve suggests the market expects stronger economic growth and potentially higher inflation in the future.
- Monetary Policy Transmission: Central banks closely monitor the term structure when setting policy rates to achieve economic objectives like full employment and price stability. Changes in the yield curve due to monetary policy actions influence lending rates, asset prices, exchange rates, and overall financial conditions, thereby impacting consumption and investment decisions.
- Banking Sector Profitability: A flatter or inverted yield curve compresses net interest margins for banks, reducing profitability from lending activities. This can constrain credit supply and economic growth. A steeper curve boosts bank profits from lending, supporting greater credit extension to businesses and households.
In essence, the term structure acts as a key transmission channel for monetary policy and a leading indicator of future economic conditions. Its dynamics influence borrowing costs, inflation expectations, and lending behavior - critical factors shaping economic performance.
Does the Yield Curve Signal Recession?
The yield curve has historically been a reliable indicator for predicting recessions, but its signal has become more ambiguous recently due to the unique dynamics in the bond market. Here are the key points:
- Traditionally, an inverted yield curve (when short-term rates exceed long-term rates) has preceded nearly every recession since the 1970s. This inversion reflects market expectations of future Fed rate cuts to combat an economic slowdown.
- However, the recent yield curve inversion since mid-2022 has been accompanied by a "bear steepening" where long-term yields are rising faster than short-term yields. This is an atypical dynamic driven by expectations that the Fed will keep rates higher for longer to control inflation, rather than cut rates imminently.
- Some economists argue this bear steepening does not necessarily signal an impending recession (see this Goldman Sachs article), as the rise in long-term yields reflects resilience in the economy and diminished near-term recession fears. The high real policy rate set by the Fed is distorting the yield curve's typical recessionary signal.
- Others contend that the inverted curve, regardless of its shape, still carries predictive power for a recession within the next 6-12 months based on historical patterns. The curve reflects tighter financial conditions that could eventually trigger a downturn.
- Certain components of the yield curve, like the inflation risk premium slope, may provide more nuanced signals about recession probabilities than the overall slope alone.
Related Reading:
- The Yield Curve as a Leading Indicator (New York Fed)
- Why Does the Yield-Curve Slope Predict Recessions? (Chicago Fed)
- Yield Curve: Is This Recessionary Signal Flashing Red? (Morgan Stanley)
Back to our blog.