The Resurgence of Japan

Author: Bruce Liegel
Introduction
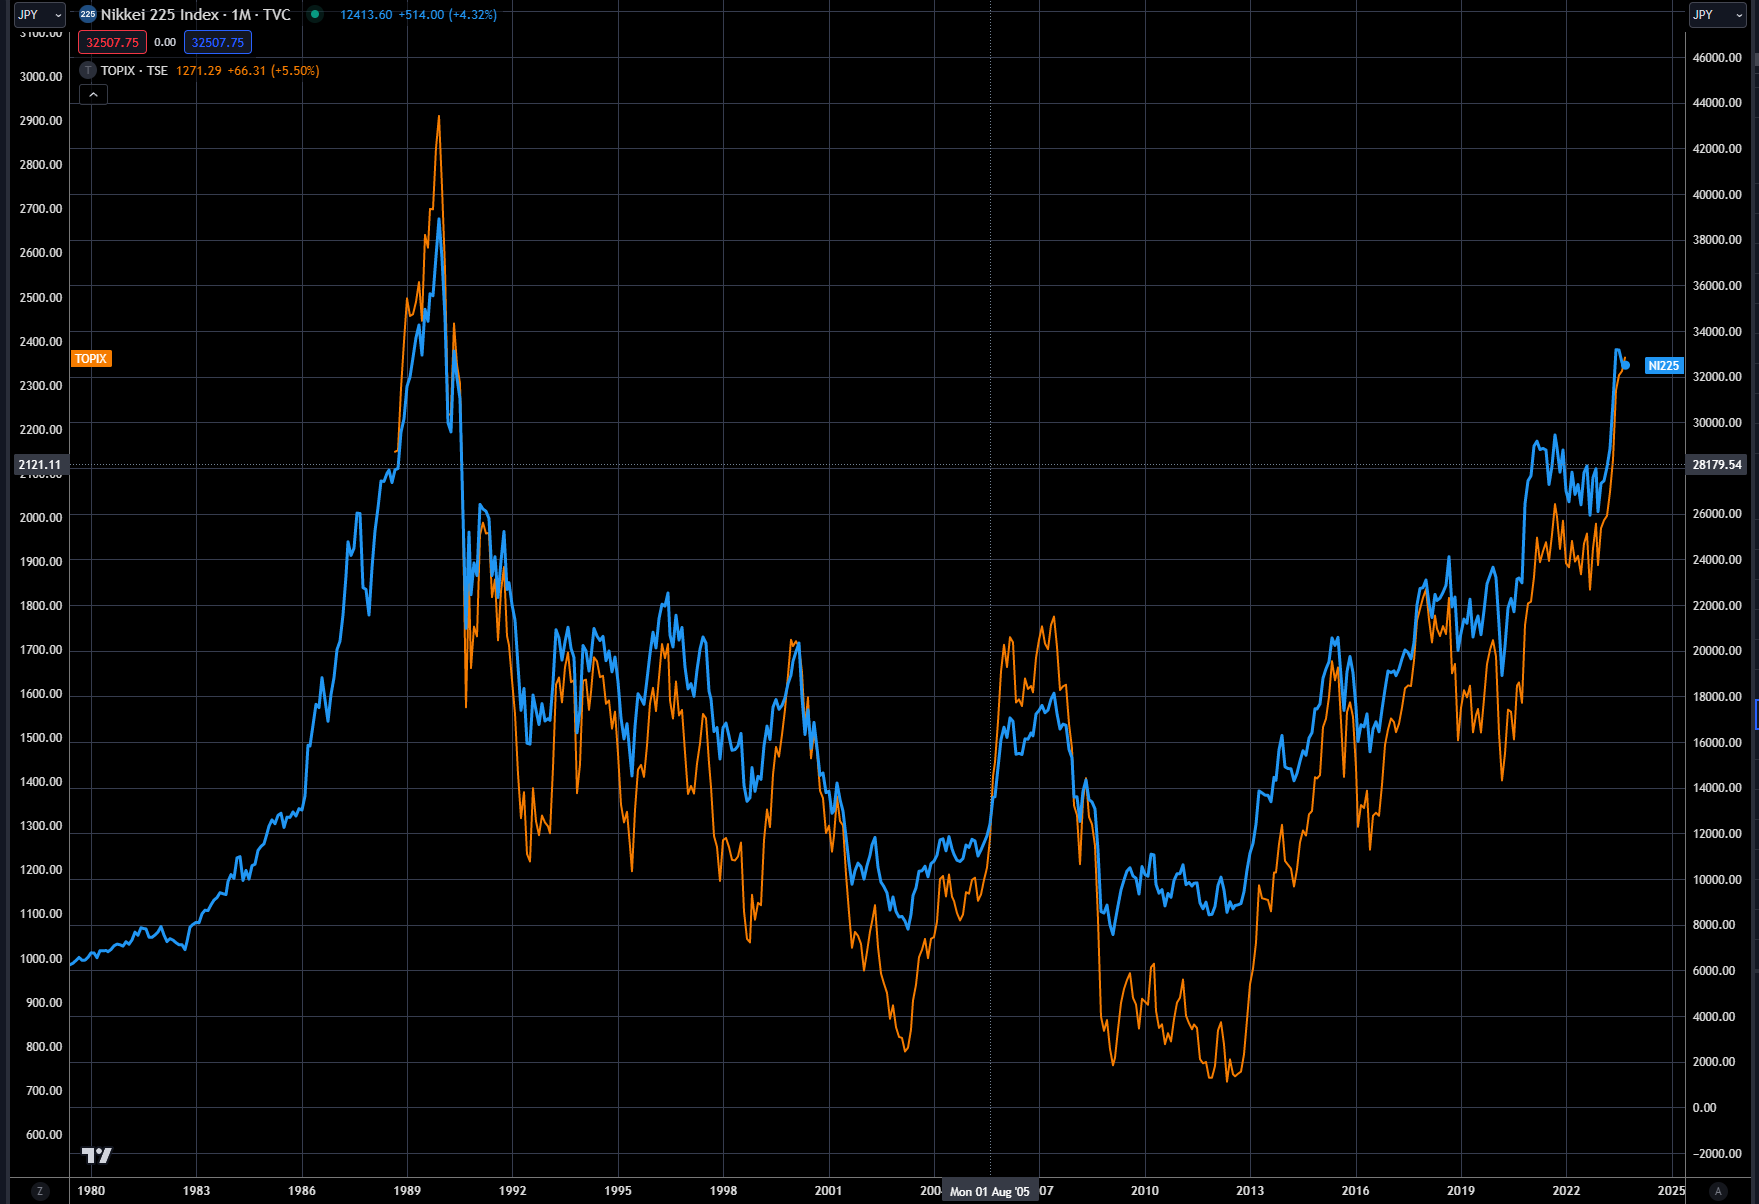
The Nikkei and Topix stock indices have been on a tear in 2023, with both indices up nearly 25% on the year in yen terms. This rally has been somewhat fueled by a weaker yen, down 12% on the year, but there is a bigger story developing. The economic outlook is the brightest it has been for a long time – remember the all-time high for Japan is from 1989-1990 (see Chart 1).
In effect, the Japanese stock market has been trading sideways to lower for the past 30 years. There are many arguments for why this has occurred, but the focus now should be on the outlook going forward. The Nikkei is now only 4000 points away from reaching the 1990 high, and appears to have strong momentum behind it.
So Japan’s economic outlook is the best it has been in a long time, but there are also underlying concerns. The Bank of Japan owns a large share of the equity market, and bond markets. Its debt levels are extremely high, and will need to be unwound. A growing concern is inflation and wage pressure which, while low, are beginning to show signs of increasing. A weakening yen has consequences when you’re importing a vast majority of your commodity needs.
Chart 1: Nikkei (blue), Topix (orange)
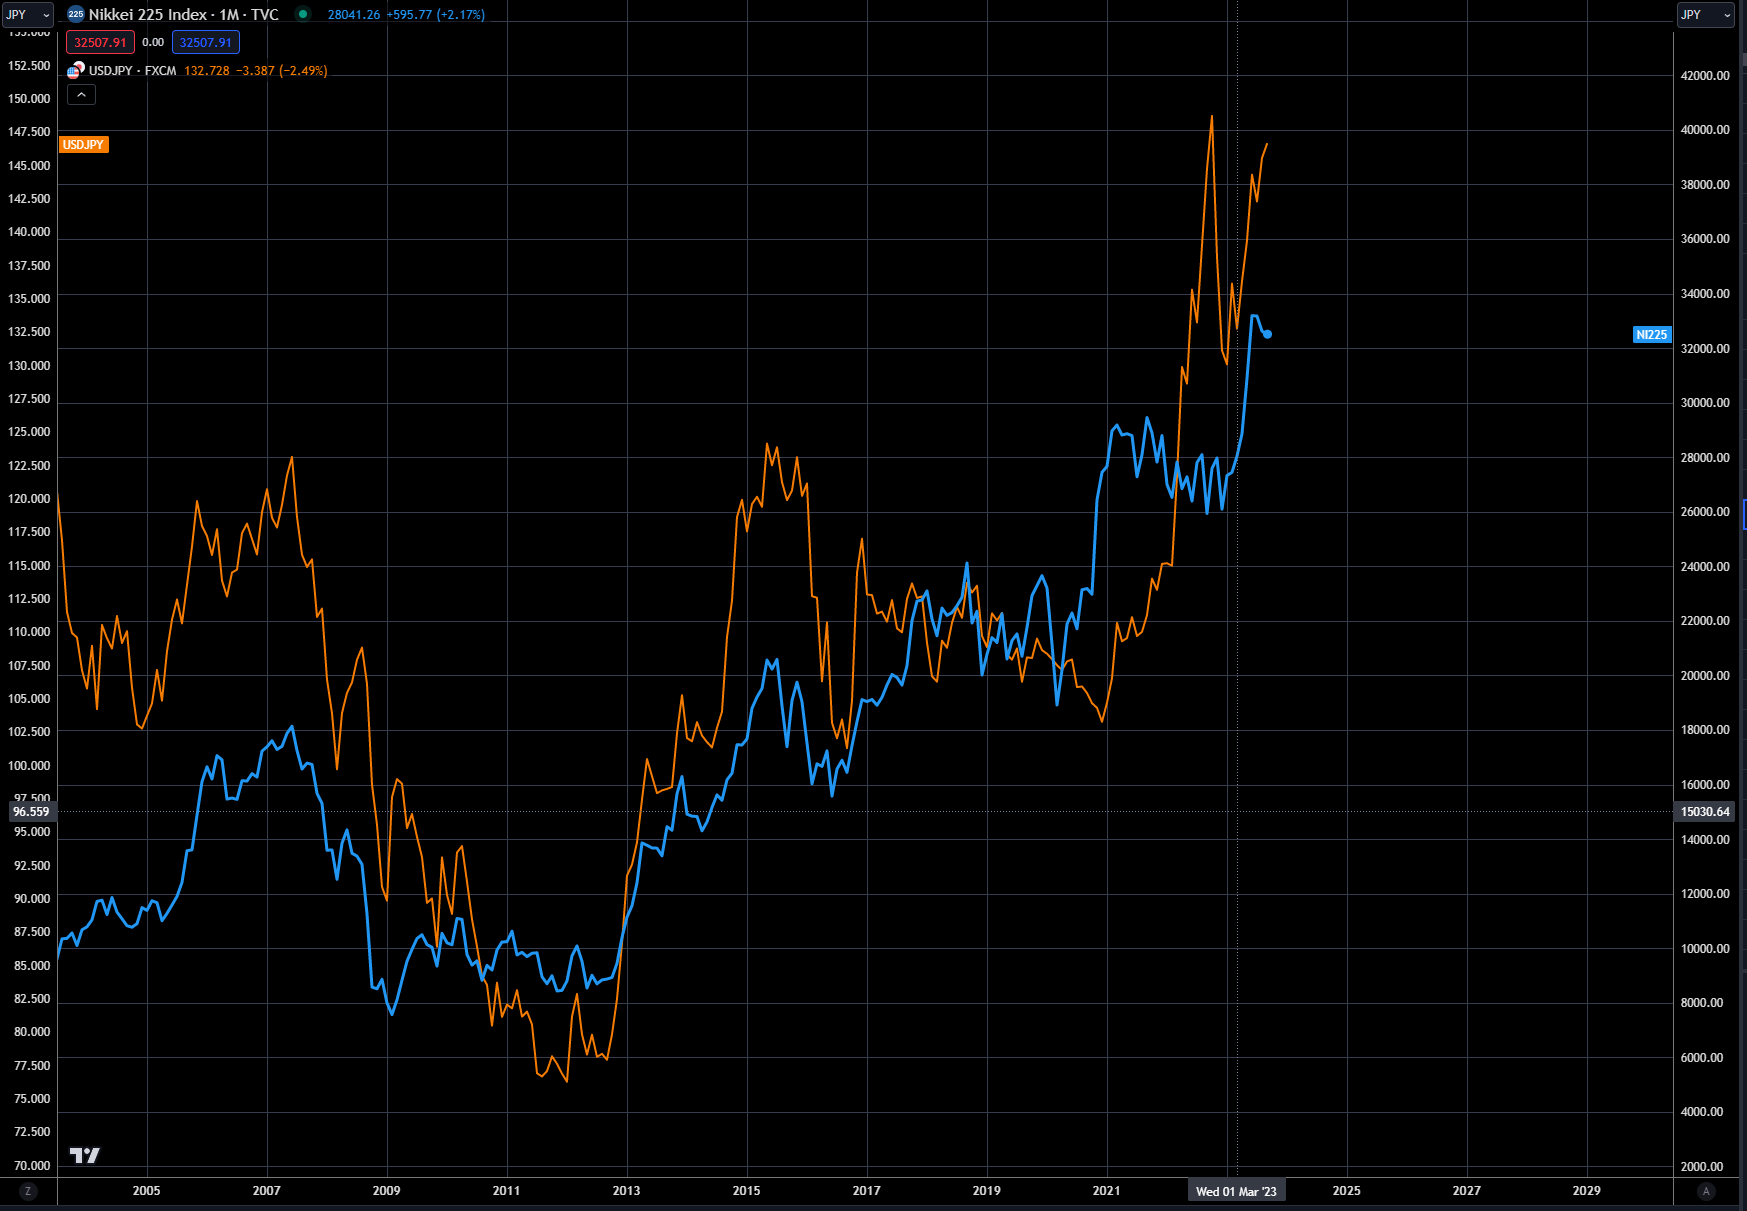
The current bull market in Japan began in 2011 with the coordinated effort to weaken the yen and the Bank of Japan’s equity-buying program. Chart 2 shows the high correlation since 2011 between the yen and Nikkei - as the weak yen has been increasing the competitiveness of the Japanese economy and its manufacturing base.
Some will argue that the yen is getting to the point where any further weakness will begin to reverse the positive action from the previous ten years. The yen has weakened from 80 to the dollar in 2011 to near 150 today - a decrease of almost 100%. Serious future issues from such a large devaluation are at risk, now that deflation is or has ended in Japan. This increase in value and the end of the BOJ equity buying could put the Nikkei/Topix rally at risk of stalling out in the next few months.
Chart 2: Nikkei (blue) vs yen (orange)
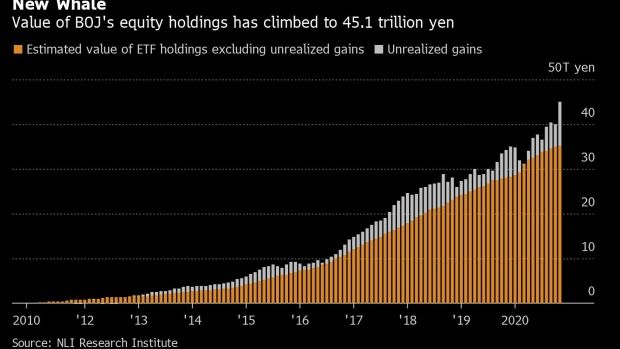
Since 2011, the Bank of Japan has been the BID in the domestic stock market, with Charts 3-5 outlining this buying activity. While Chart 3 ends in 2016, it shows the programs that were put in place by the BOJ under Haruhiko Kuroda, the 31st governor of the BOJ (2013-2023).
Chart 4 shows that the program continued through 2020 and the BOJ has been quite inactive during the last 2-3 years. Based on current market valuations, the BOJ owns over 50% of the ETF market. While the BOJ buying program has slowed, the value of the yen has plummeted since the end of 2020, falling from 100 to 150. This weakening is now the driver of the Japanese economy, along with retail and institutional investors like Warren Buffet putting money to work in the Japanese stock market.
Chart 3
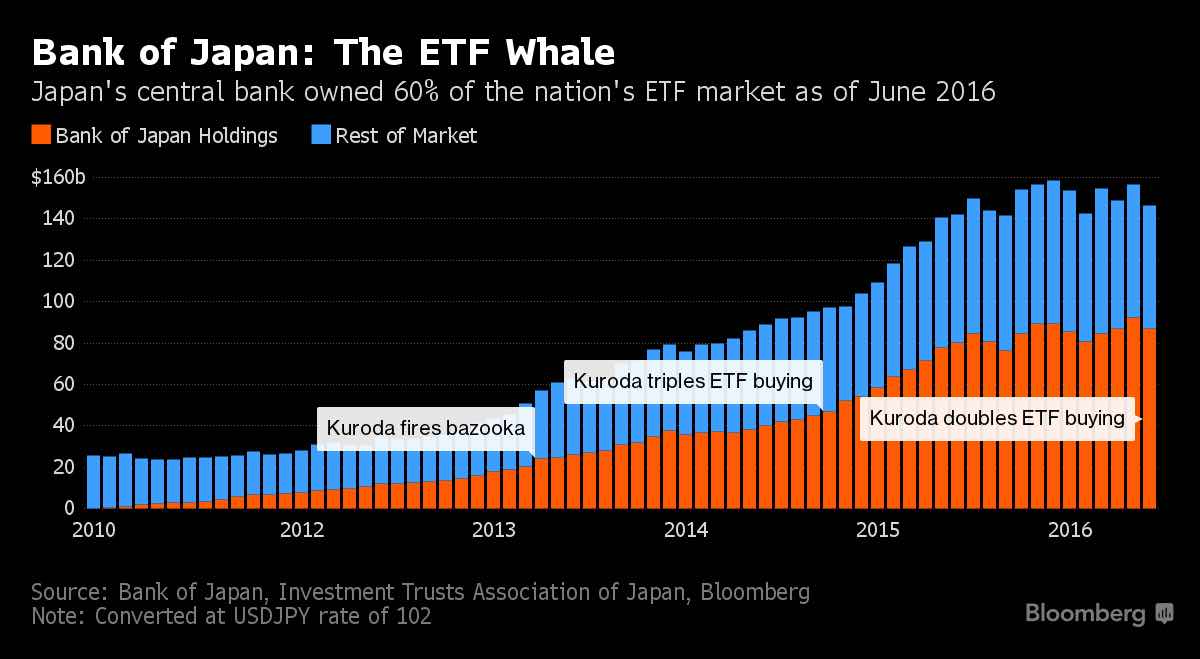
Chart 4
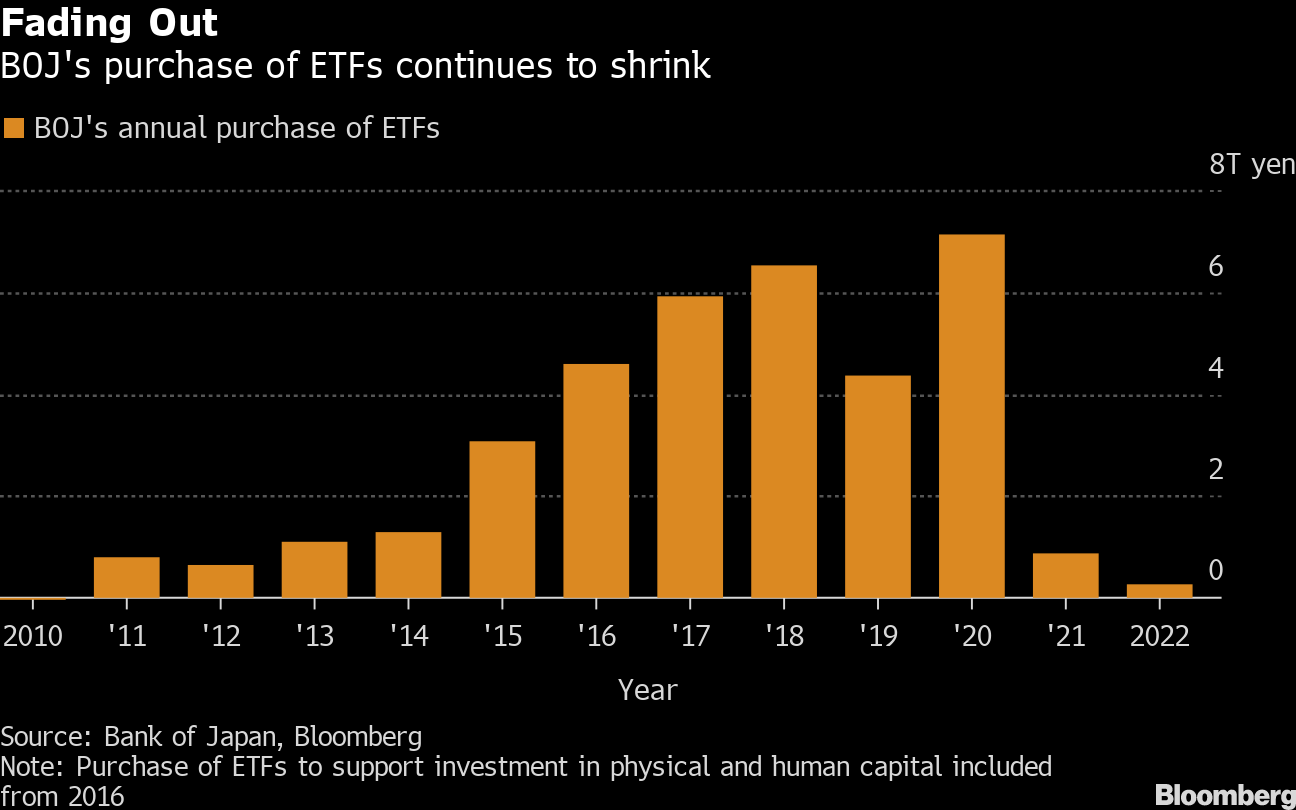
Chart 5 shows the valuation of the ETF buying program through 2021, with the current stock valuation at over 50 trillion yen according to the central bank's earnings data. So, in essence this has been a pretty good trade by the BOJ. While they have not been an active buyer recently, at some point they will need to reduce their balance sheet, and selling into market strength makes a lot of sense at this juncture.
Chart 5
High debt and how to unwind it
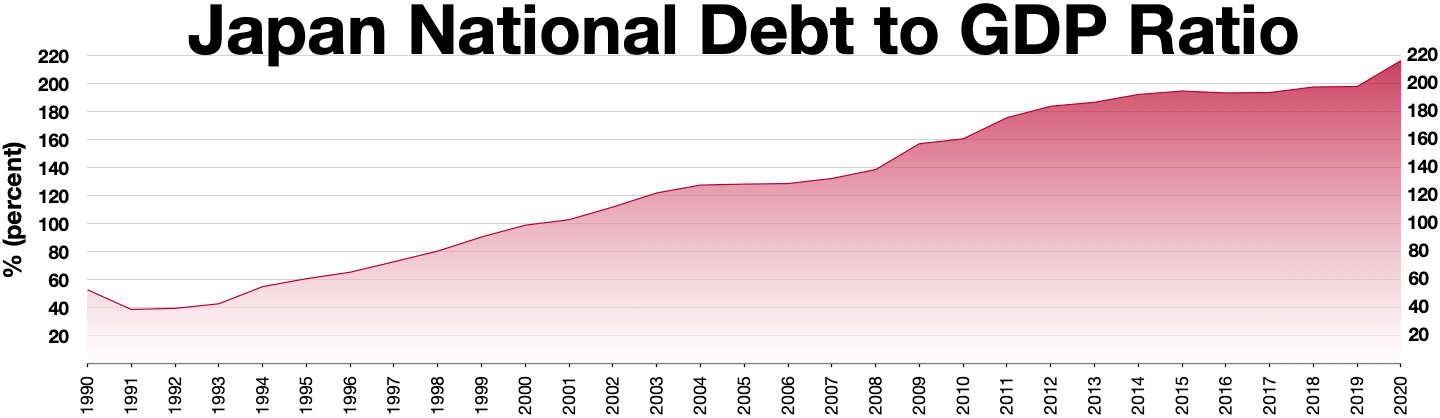
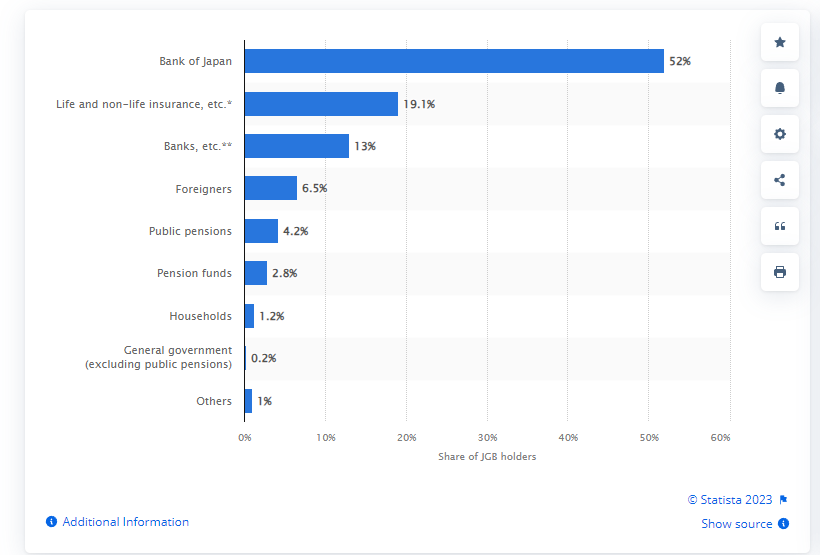
All of this buying also comes at a cost, as debt has accelerated over the past 20 years. As of March 2023, Japan's debt is estimated to be 9.2 trillion in USD. Chart 6 shows the very high levels of debt to GDP - at over 200% - something that was outlined in great detail in some of our earlier deep dives. What is also concerning is the high concentration by the BOJ. Chart 7 shows that the BOJ is the owner of over 50% of the JGB market.
The question for the market is how all of the debt and equity is unwound without causing major havoc in the Japanese and global markets - only time will tell how successful the BOJ has been with this strategy.
Many are now second-guessing the US Federal Resserve’s monetary policy, now that inflation and interest rates have increase md dramatically. Will the BOJ have the same issues in a few years?
Chart 6
Chart 7: Distribution of Japanese Government Bond (JGB) holders as of December 2022
Economic indicators
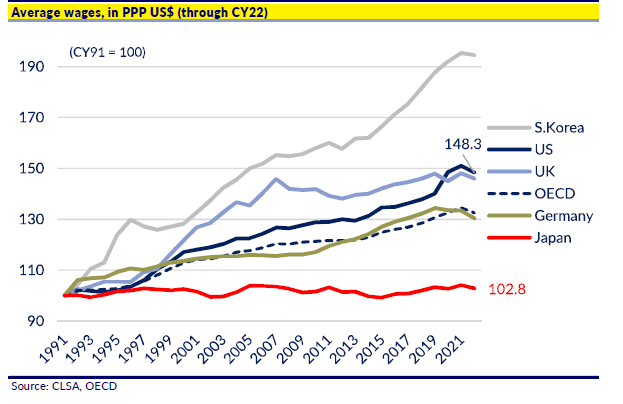
When looking at Japan’s economic indicators, you can get a sense of why it is currently an attractive environment to invest in. While it is true that its inflation is trending higher, Japan still has the lowest rate for most westernized economies - see Chart 8. This is a distinct advantage going forward as the follow-through effects on labor are not being seen in Japan as is the case in the rest of the G7. Chart 9 shows the year-over-year wage growth in Japan and it clearly shows there is no wage spike occurring - meaning a wage spiral currently does not appear to be a risk.
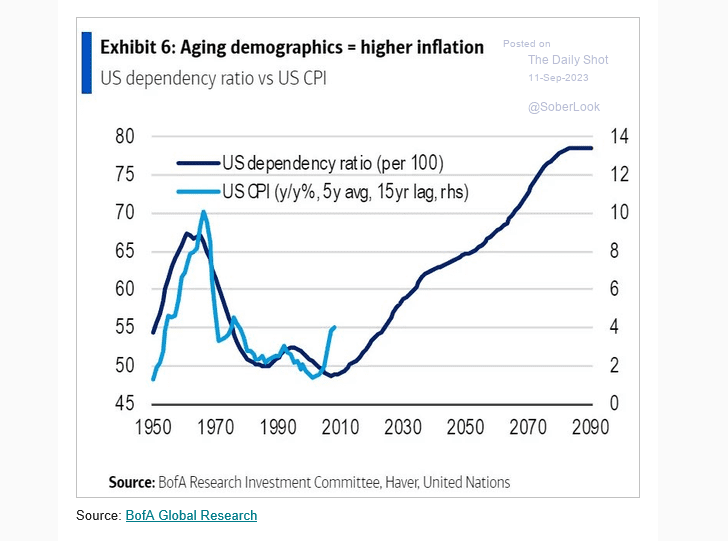
Longer term, based on our earlier deep dives, the impacts will be felt as we are now just in the early stages of a major transition from a low interest rate and inflation world. Chart 10 lays out this scenario if you have not read some of our earlier research published this year. This data is for the US, but it is relevant globally, as all economies are aging except India.
Chart 8
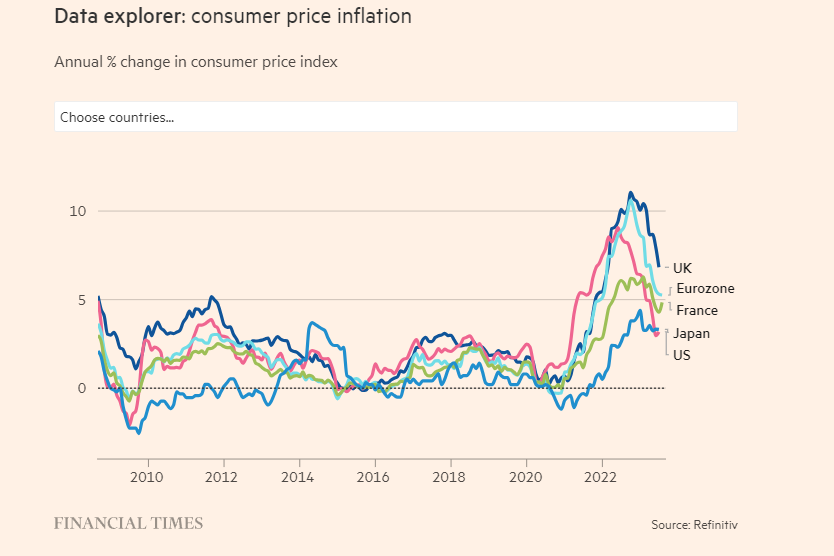
Chart 9: Wage growth in Japan
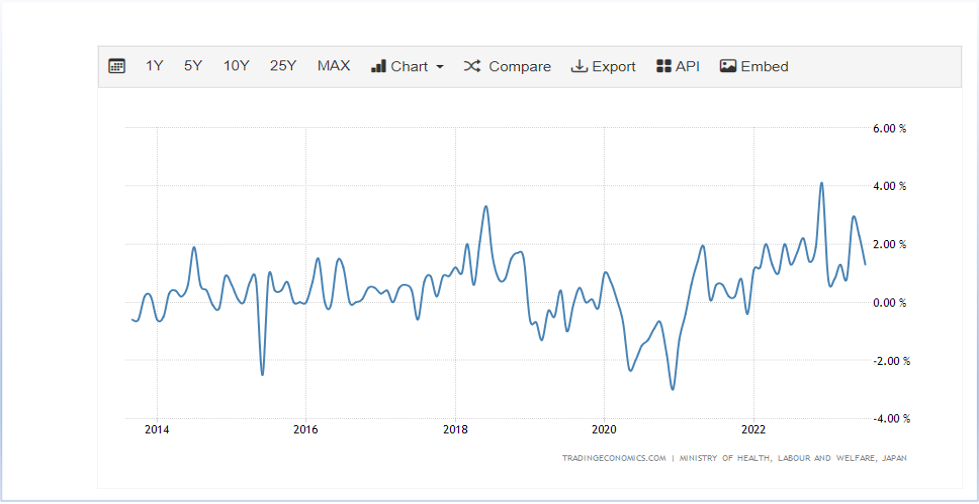
Chart 10: Aging demographics and inflation correlation in the US
The Japanese markets have been priced for deflation - same game plan for the past 25 years - and this is now changing, via higher nominal GDP growth. Charts 11 and 12 show the robustness now in the economic growth engine in Japan. Chart 11 shows GDP in YoY growth, with second-quarter GDP initially at 6% but revised down to a still-strong 4.8%. While Chart 12 shows GDP in yen terms, and it is exploding, led by a strong corporate sector.
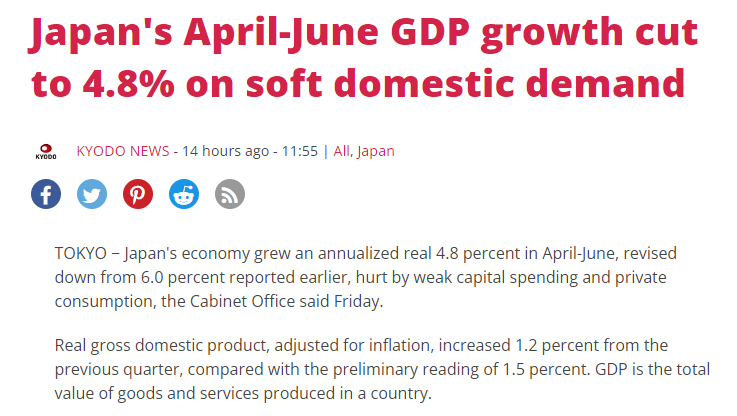
Chart 11: Japanese GDP YoY return
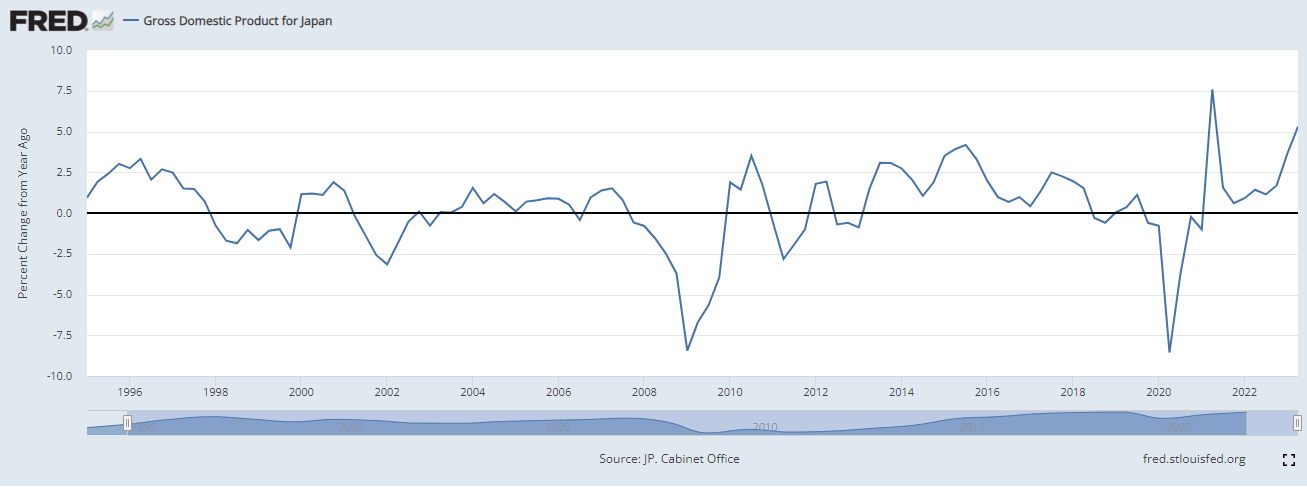
Chart 12: Japanese GDP in yen
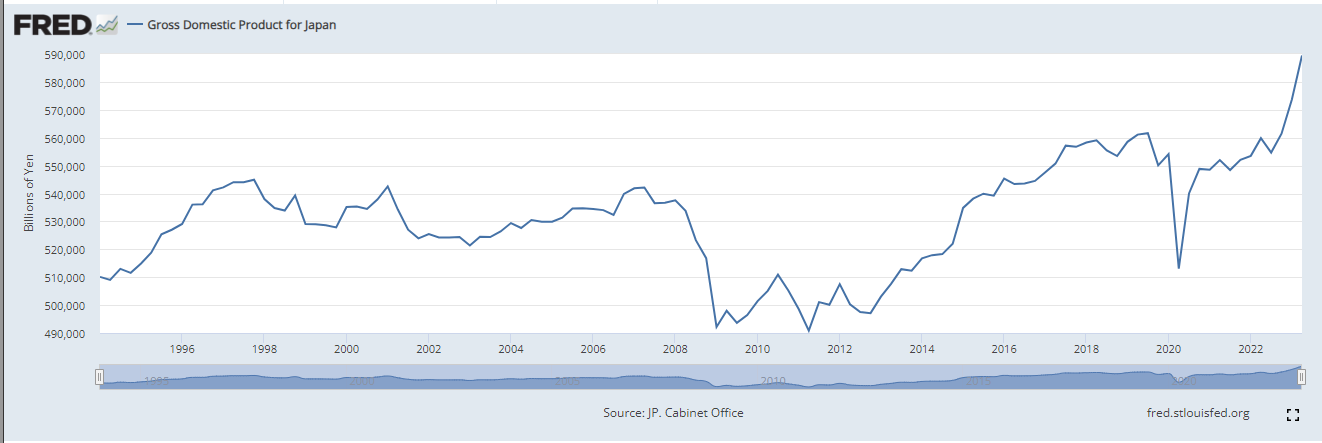
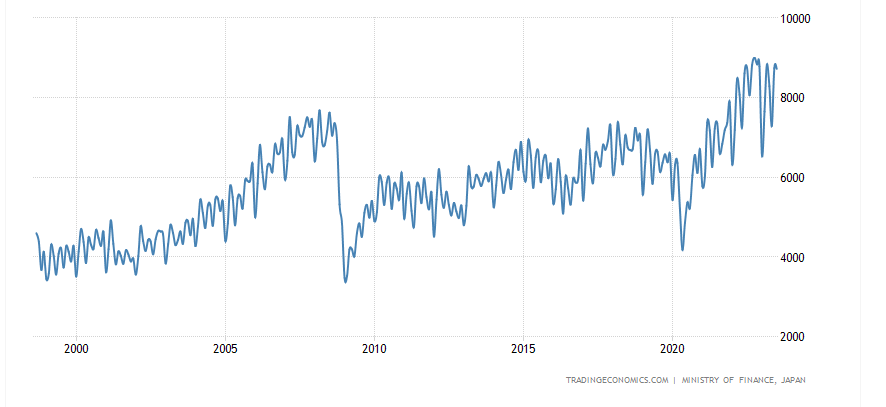
Chart 13: Japanese exports in billions of yen
One of the bright spots
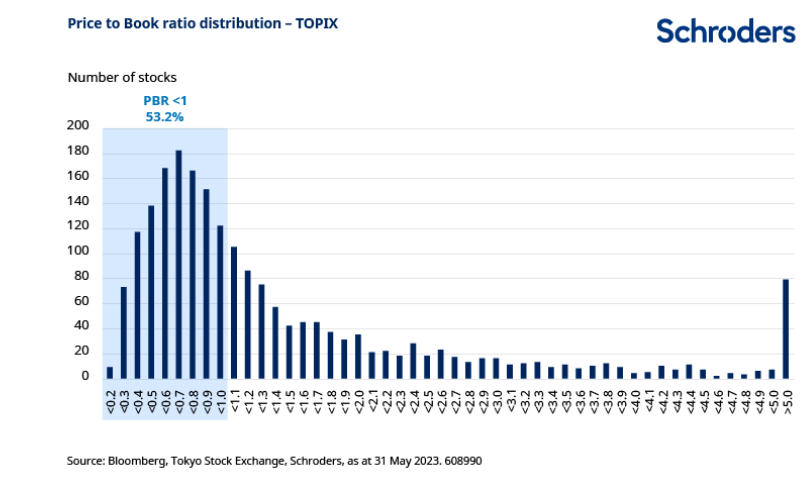
Based on economic indicators alone, Japan has been a compelling story, but the internal mechanisms that are used to price companies also signal a very positive story in the country. In Chart 14, the price-to-book ratio for the Topix is presented. The Topix is the cap weighted index for all the large firms on the TSE exchange - the first section.
A majority of these stocks are trading well below or at book value - book value being the liquidated value of the company. Now, it may be safe to assume that many of these are valued correctly, but Japan has been priced for deflation over the last 20 years - meaning no price appreciation is or was expected. This is now changing: the Topix, while in a 13-year bull market already, could still be in the early stages of a longer-term bull market. Remember, equities in Japan have traded sideways to lower since 1989.
Chart 14
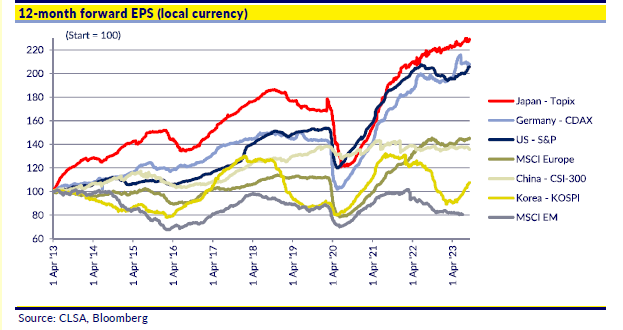
Another very attractive metric is the 12-month forward EPS, shown in Chart 15. The Japanese Topix looks very promising when you look at forward earnings, especially versus other similar global indices. The weak yen is fueling a resurgence in the corporate sector of Japan, driving earnings higher, which is fueling the drive in the stock market.
Chart 15
Relative to China, Japan is now one of the main bright spots in Asia. For the past year, and somewhat prior to this, the yen has been highly correlated to the Chinese yuan, as shown in Chart 16. Both currencies have devalued versus the US dollar tremendously over the last few years.
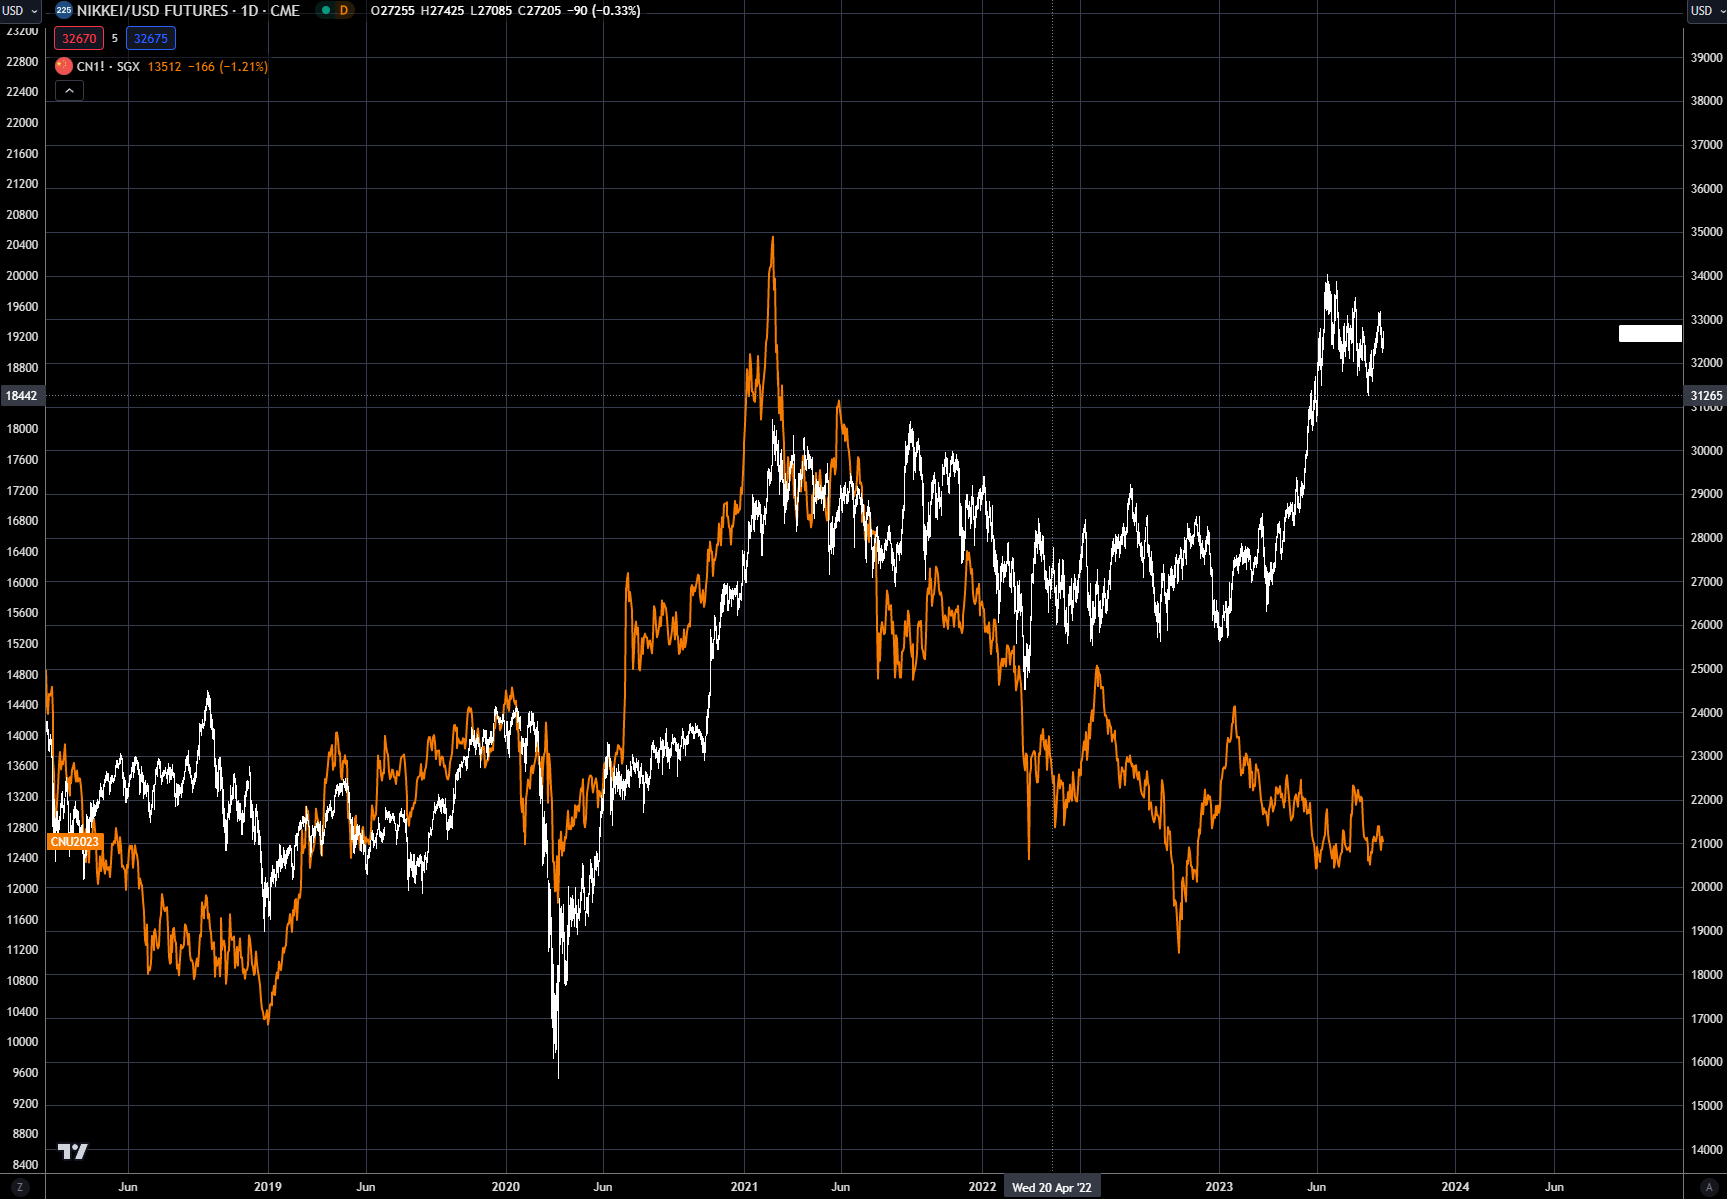
While this is somewhat intriguing, what is really interesting is in Chart 17. The Nikkei/Topix had been quite correlated with the China A50 stock index, until just a few months ago. Since the start of the year the two have separated, with the Nikkei shown in white having an explosive move higher, while the China A50 has traded sideways to lower.
Does this mean that Japan is taking over the leadership role in Asia? Possibly, in the interim. Japan is in an uptrend while China is sideways to lower - easy decision.
Chart 16: Japanese yen (orange) versus Chinese yuan (white)
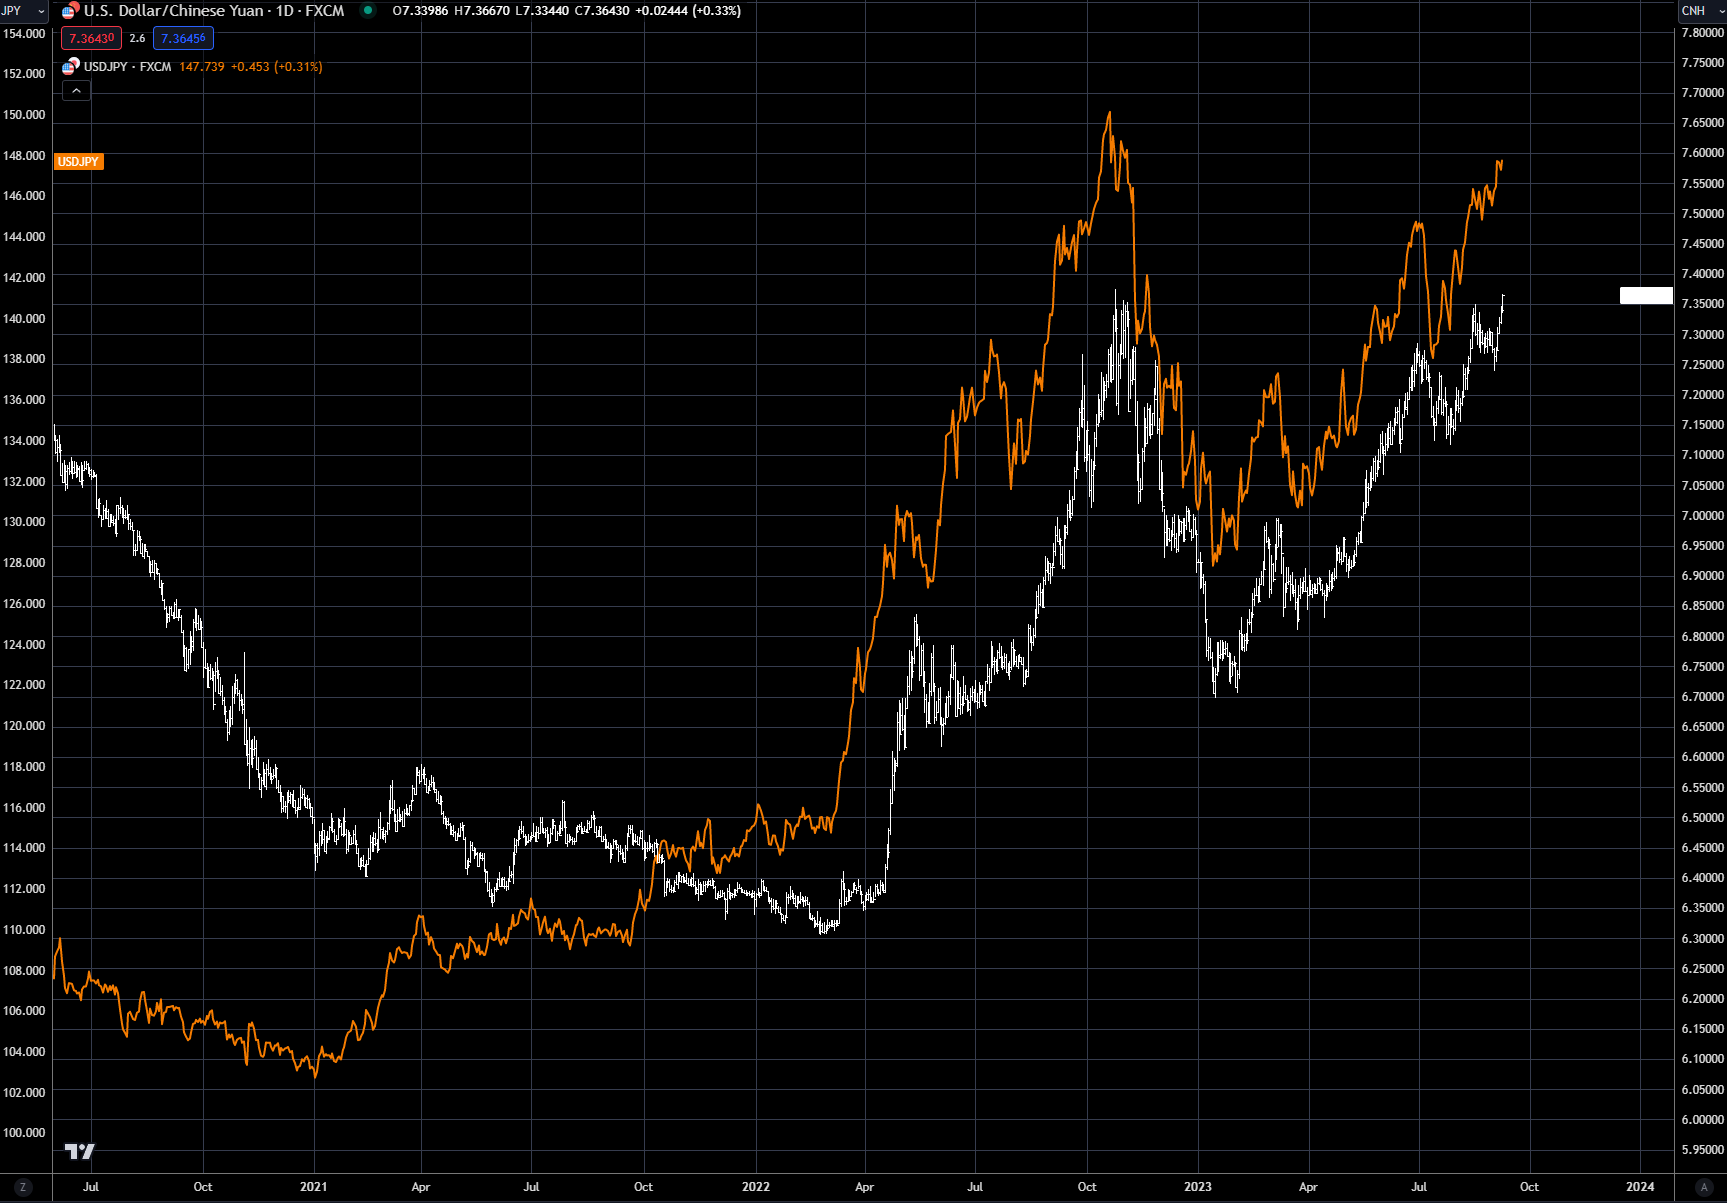
Chart 17: Nikkei (RHS in orange) versus China A50 (LHS in white) in USD
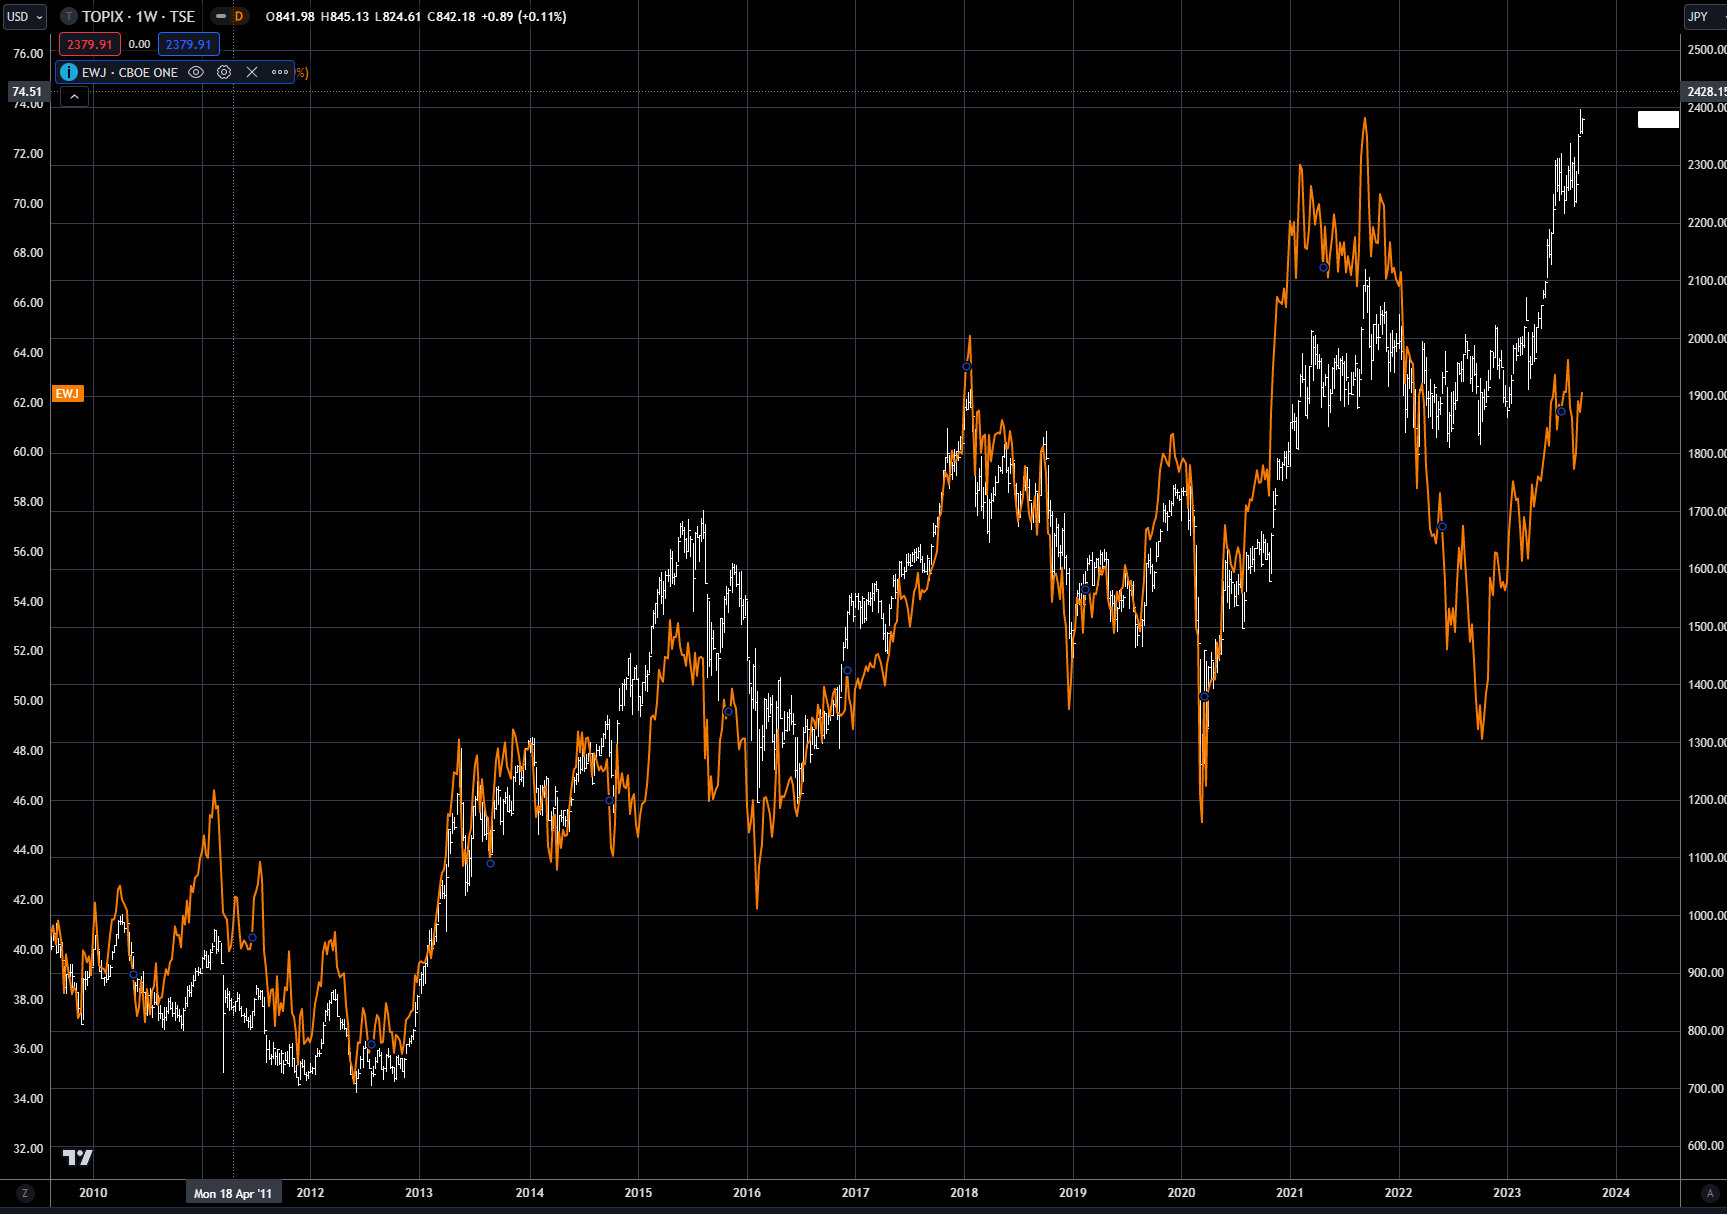
There are a few ways to invest in Japan via the US markets. EWJ is the iShares Japan ETF and is traded in USD. In Chart 18, the Topix in yen is overlaid against the EWJ in USD - they do a nice job of tracking each other, although the currency slippage is quite apparent over the past few months. The exchange-rate differential causes some volatility between the two returns - but still, EWJ is a good way to get exposure to Japan.
Chart 18: (RHS in white) and EWJ (LHS in orange)
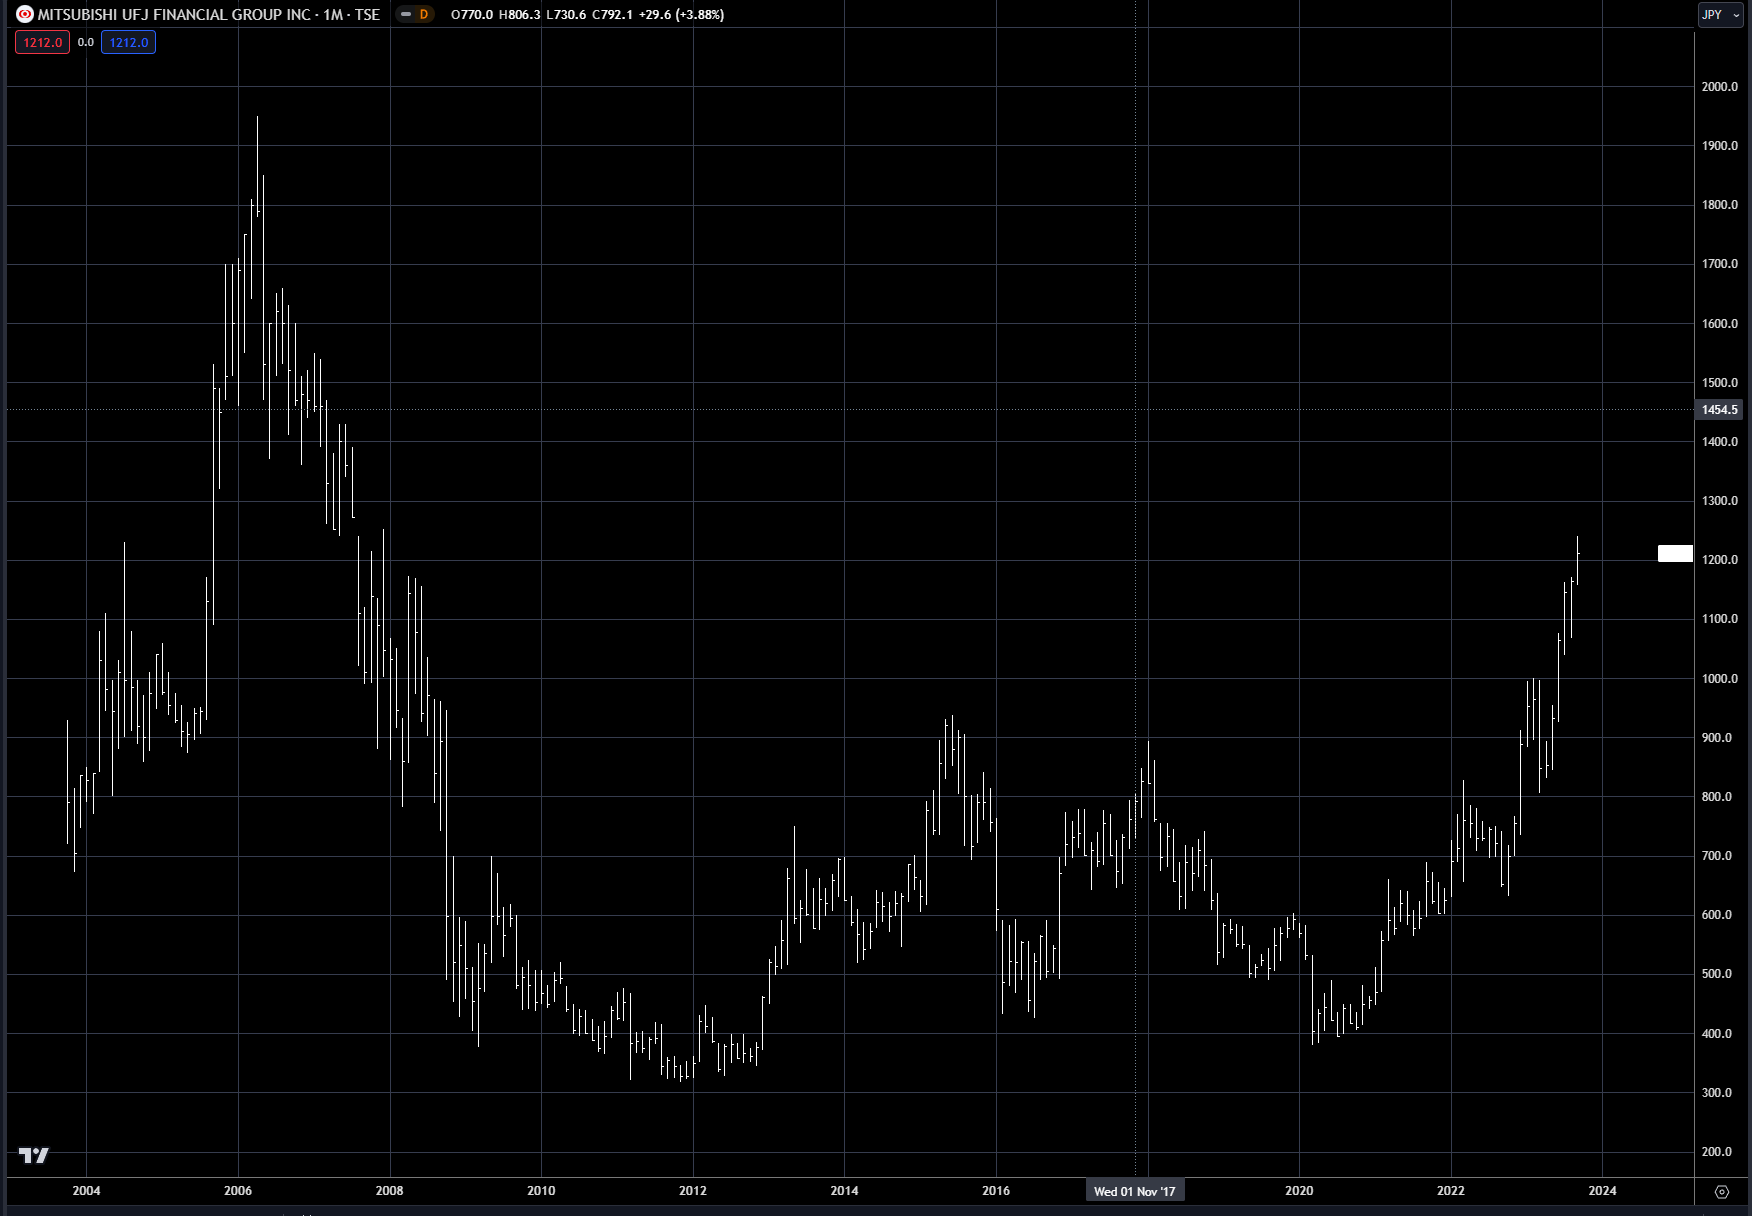
The Japanese banking sector is another way to play the resurgence, with Mitsubishi Financial Group the largest bank in Japan. Chart 19 shows the returns in USD, by investing in MUFG, which is listed on the NYSE. Since the 2020 low the stock is up 148%, but it is still quite cheap relative to where it has been over the last 10 years. Chart 20 shows the same stock listed on the TSE under the symbol number 8058, and in yen terms the stock is up over 300%. Depending on an investor's FX preference, this stock could be traded based on that.
Chart 19: Mitsubishi Financial Group in dollars - up 148% since 2020 low
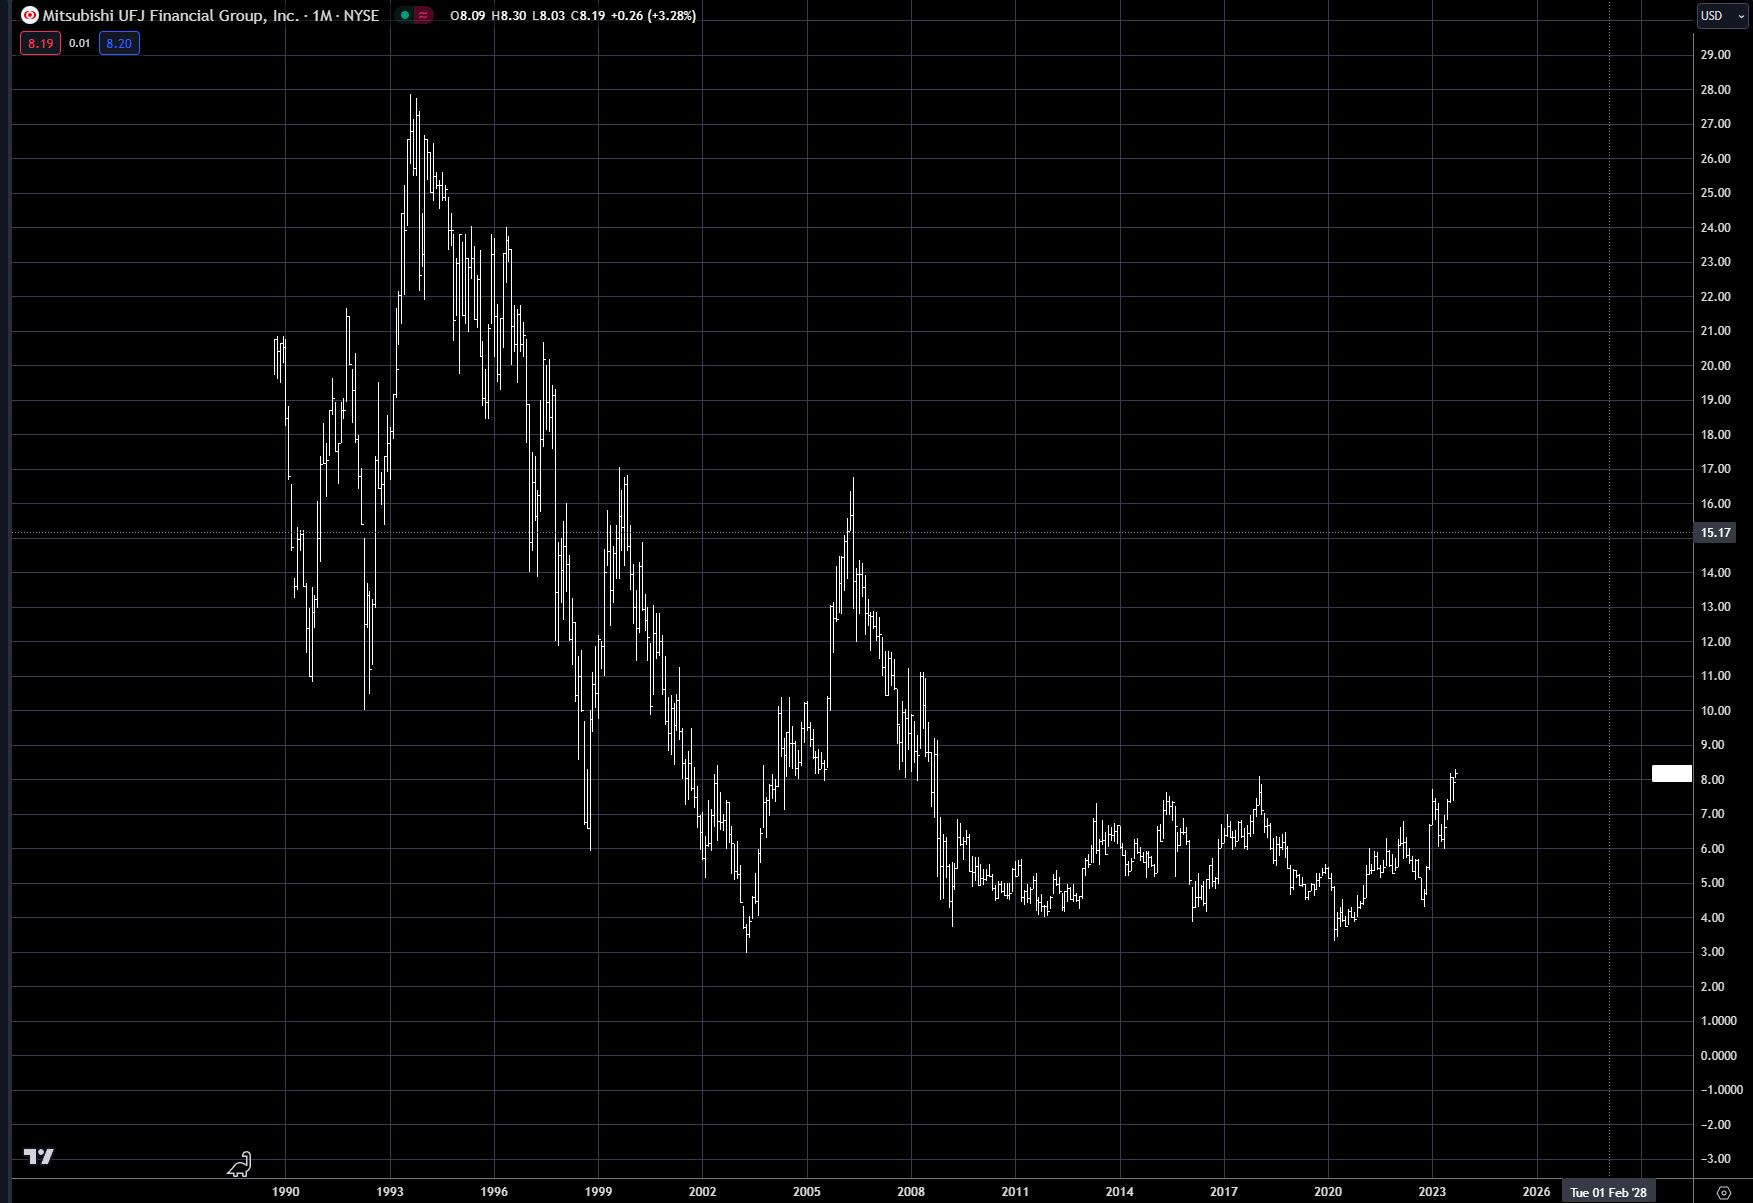
Chart 20: Mitsubishi Financial Group in yen - up 300% since 2020 low
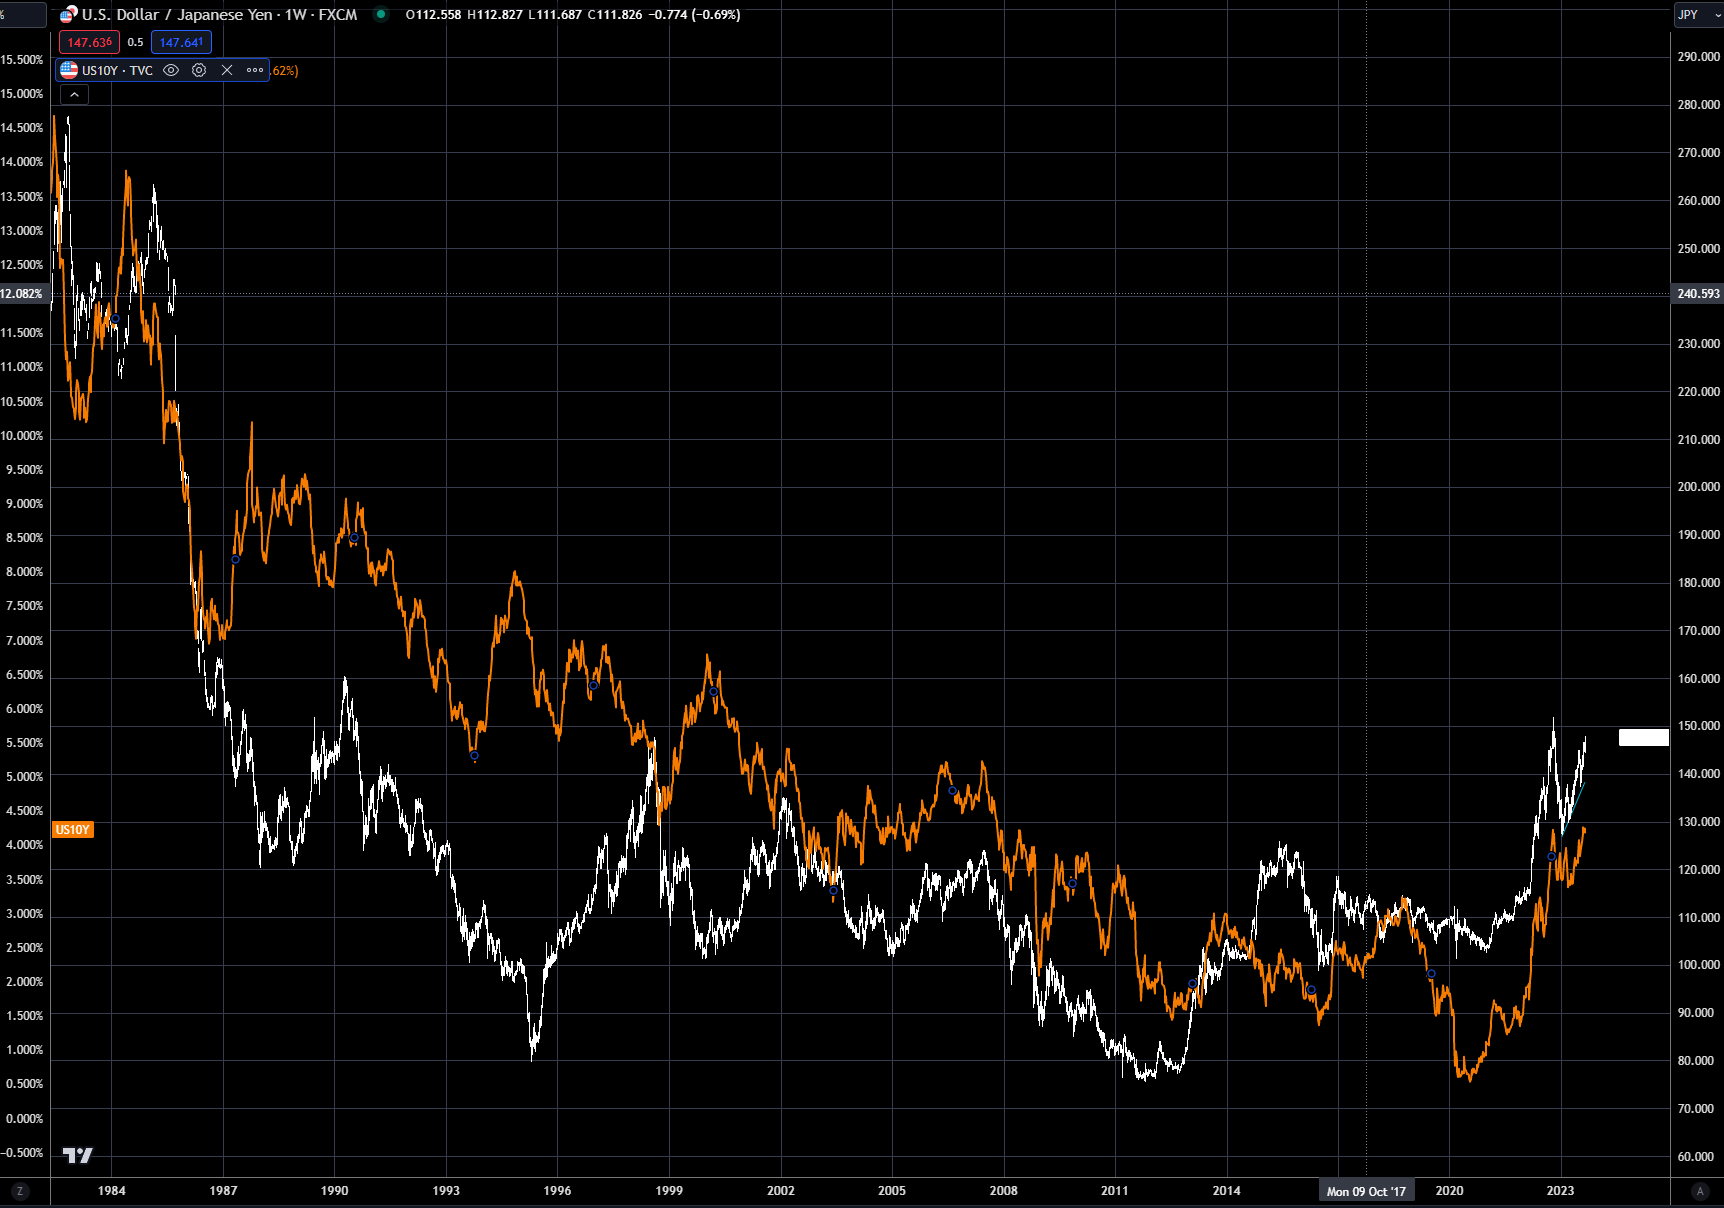
Another way to trade it, with some divergent risk, is to trade the US 10-year. It was shown earlier that the yen and the Nikkei/Topix are highly correlated at the moment. Chart 21 shows the yen versus the US 10-year. They have been moving in lockstep now for over 10 years. If an investor were looking to use leverage on this trade, US treasury futures traded on the CME could be a great option. The CME also offers a Nikkei futures contract that trades in USD that is very active.
Chart 21: Yen versus US 10-year
Appendix
Trading strategy is based on the author's views and analysis as of the date of first publication. From time to time the author's views may change due to new information or evolving market conditions. Any major updates to the author's views will be published separately in the author's weekly commentary or a new deep dive.
This content is for educational purposes only and is NOT financial advice. Before acting on any information you must consult with your financial advisor.