Rates Made New Highs and Energy Rallied
Author: Bruce Liegel
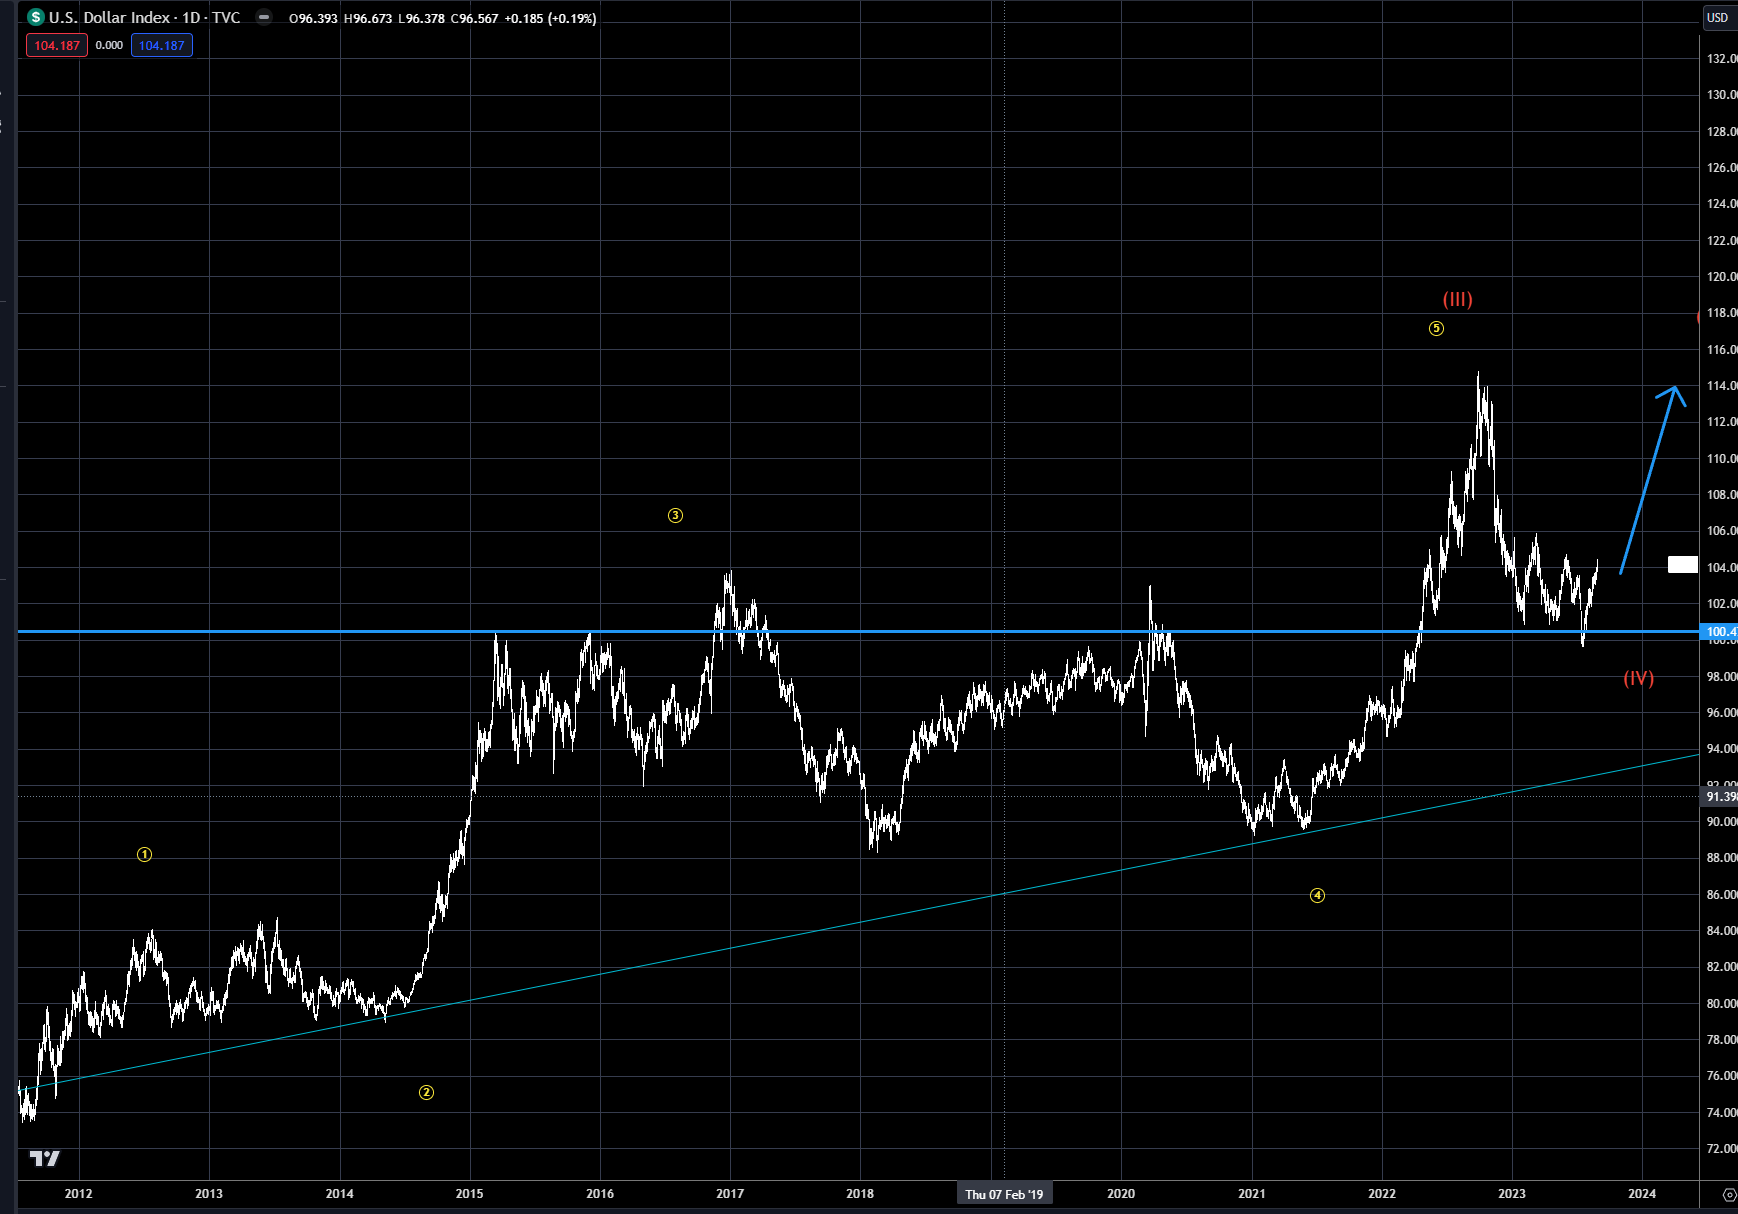
The dollar index has held the key support near 100, marked by the horizontal blue line on Chart 1 below. The dollar has had a nice 4% or so bounce off this support, starting off the final rally from the 2011 low. In the short run — next week or so – the dollar should pullback from the 104 level, but look for pullbacks as buying opportunities
Chart 1 DXY Index
The US 10-yr made new highs for the move (from 2020 low) last week, trading around the 4.40% level. See Chart 2. Our long-term target has been in the 4.50-4.75% level, and we are getting close to this level – but we are not there yet. Be patient in locking in longer term duration, as the trend upside may still have a blow off top prior to the end of this tightening cycle.
Chart 2 US 10-yr Rate
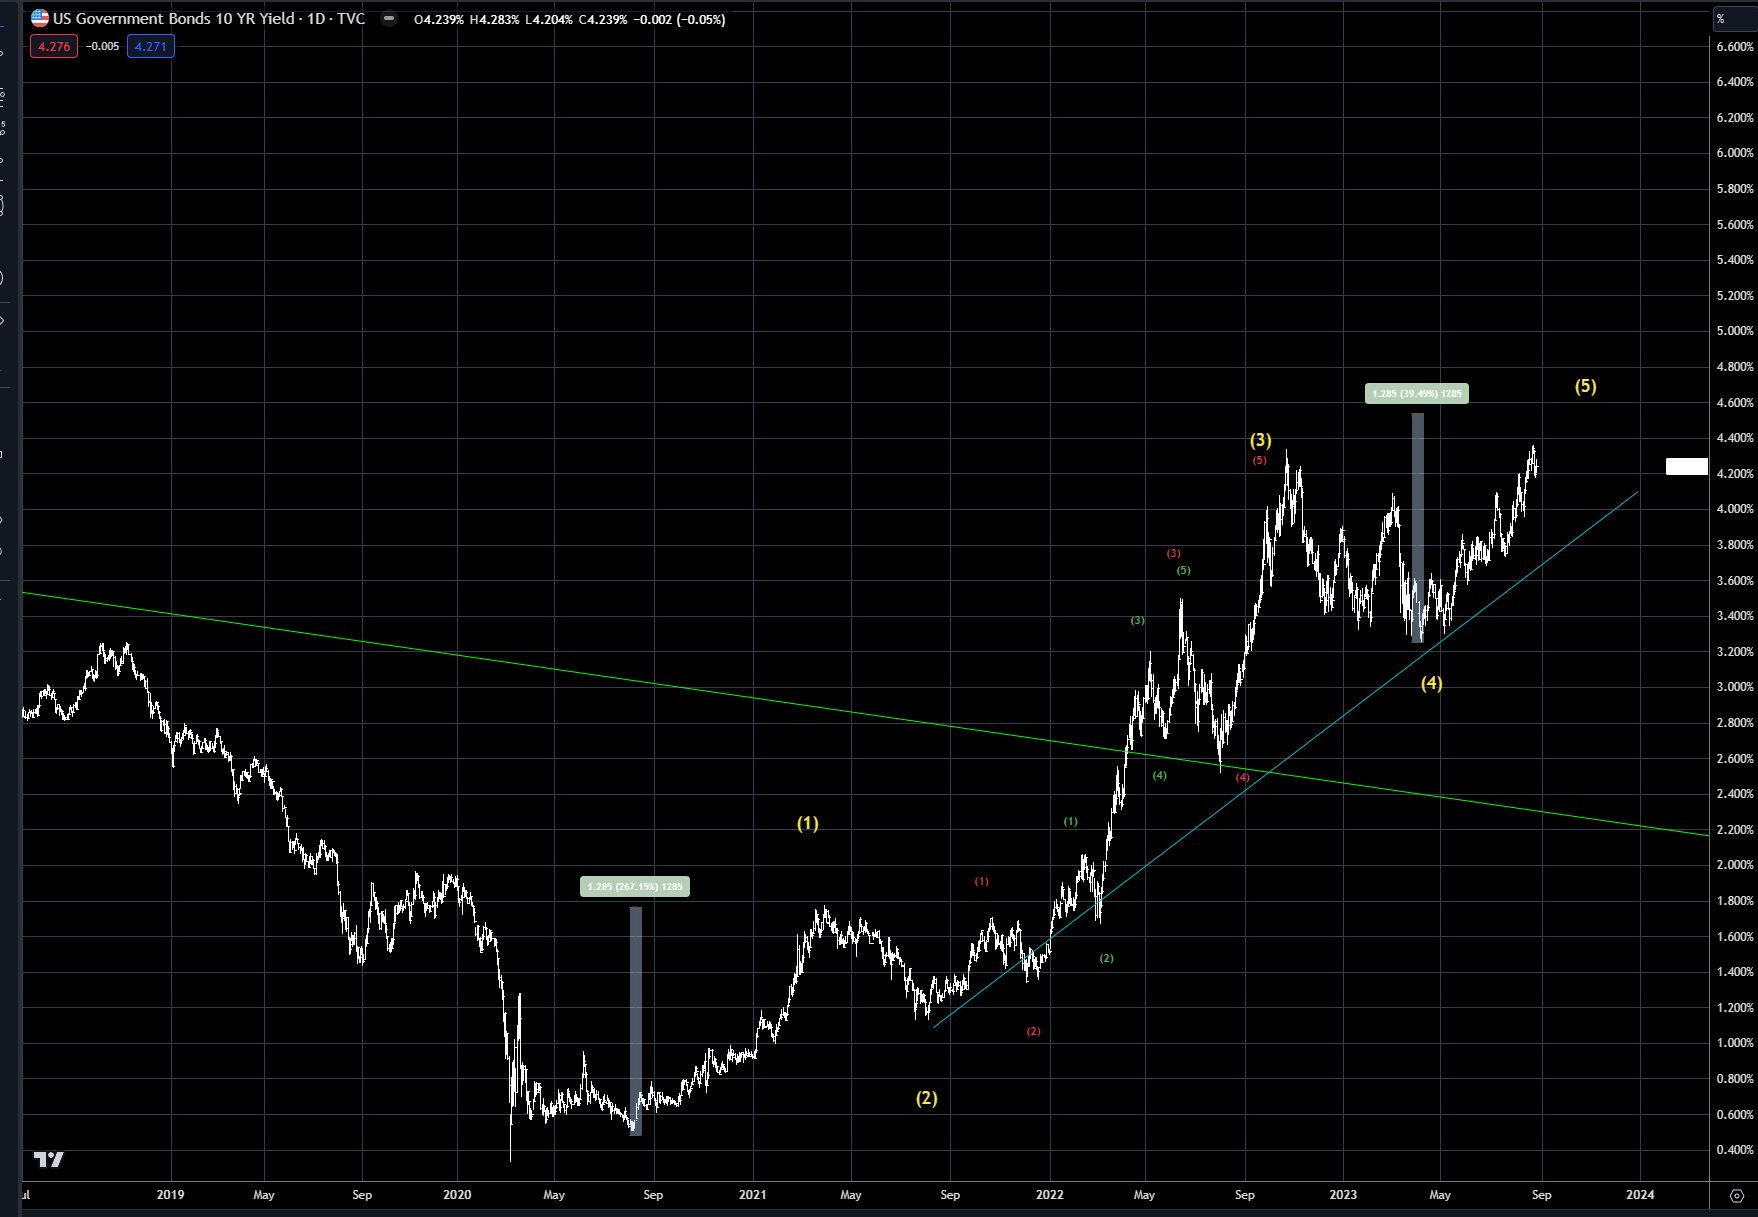
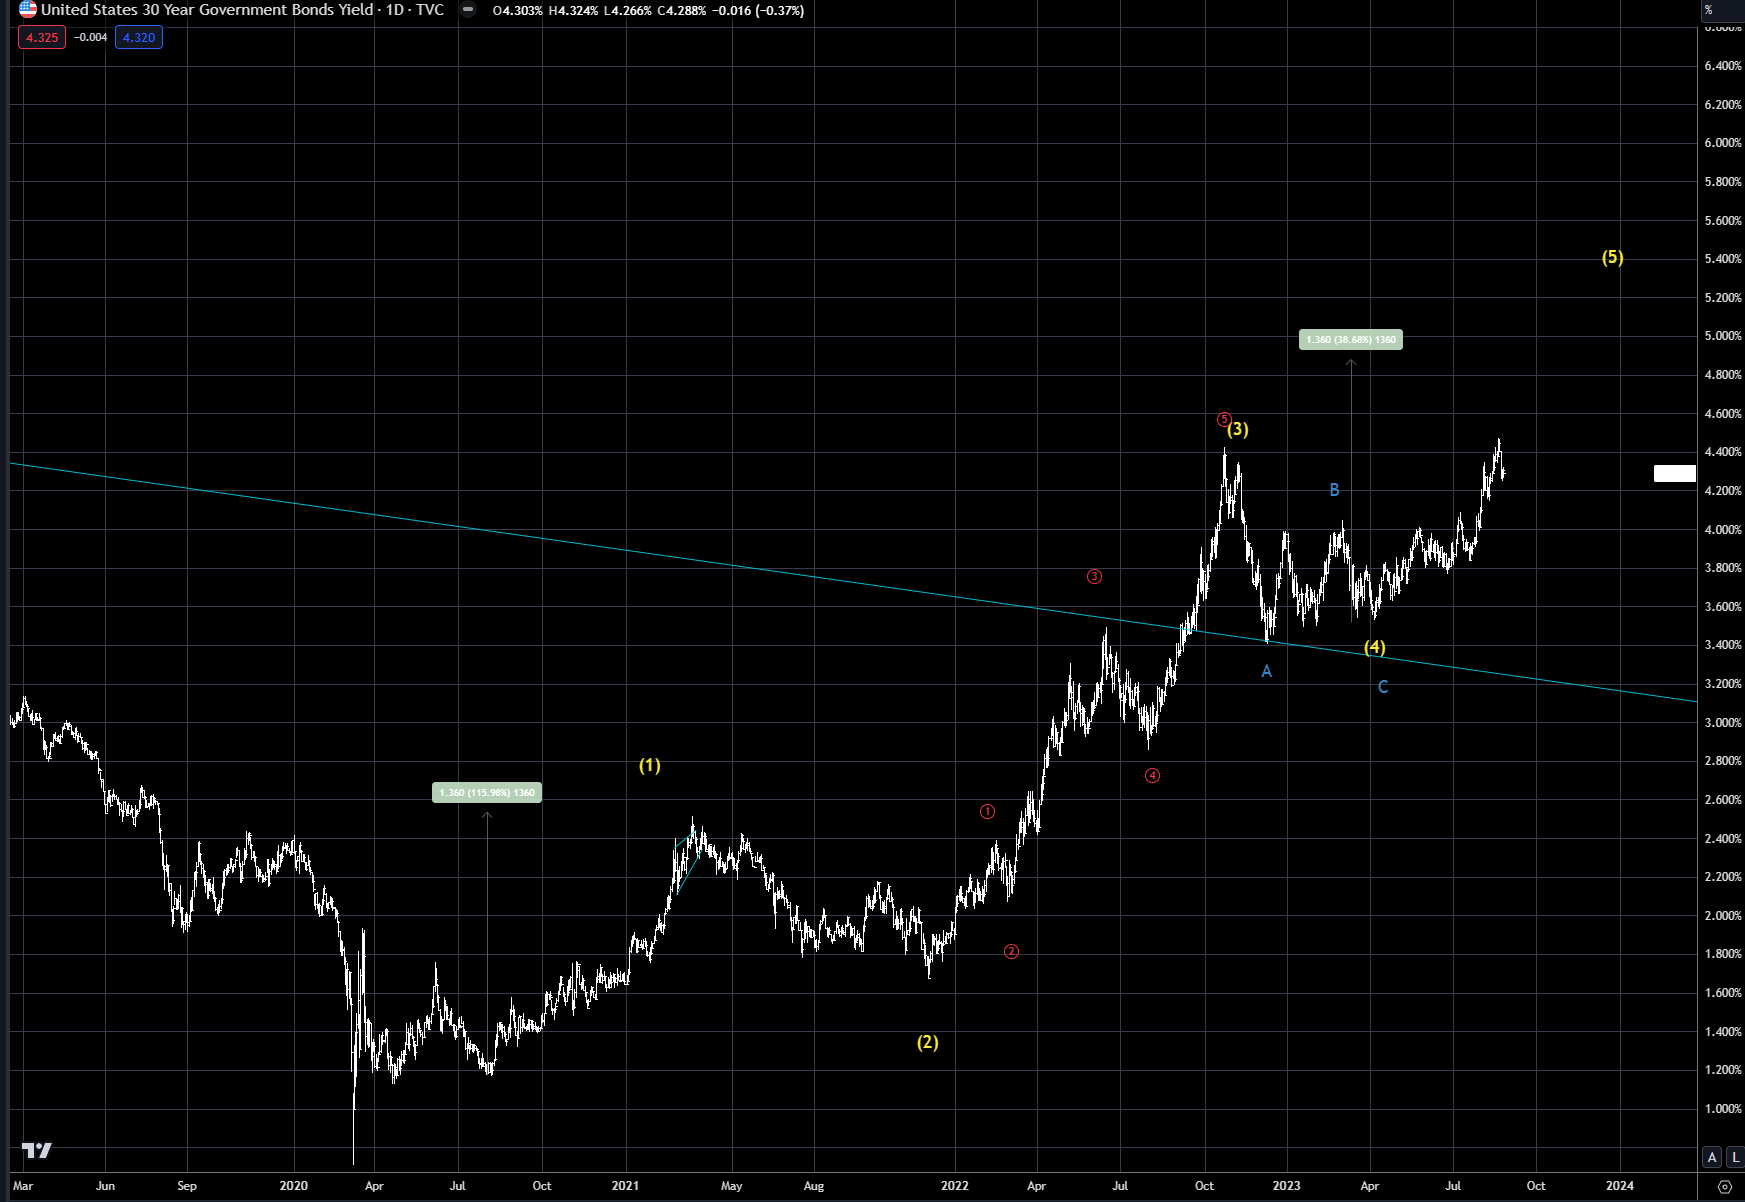
Chart 3 shows the US 30-yr, and it also made new highs for this tightening cycle. The upside target for the 30-yr is close to 5%, which is still 50 bps or so away. Now that the long end of the curve is getting a bid, via the bear steepening trade, there is a very good chance this up-trend persists for another month or two.
Chart 3 US 30-yr Rate
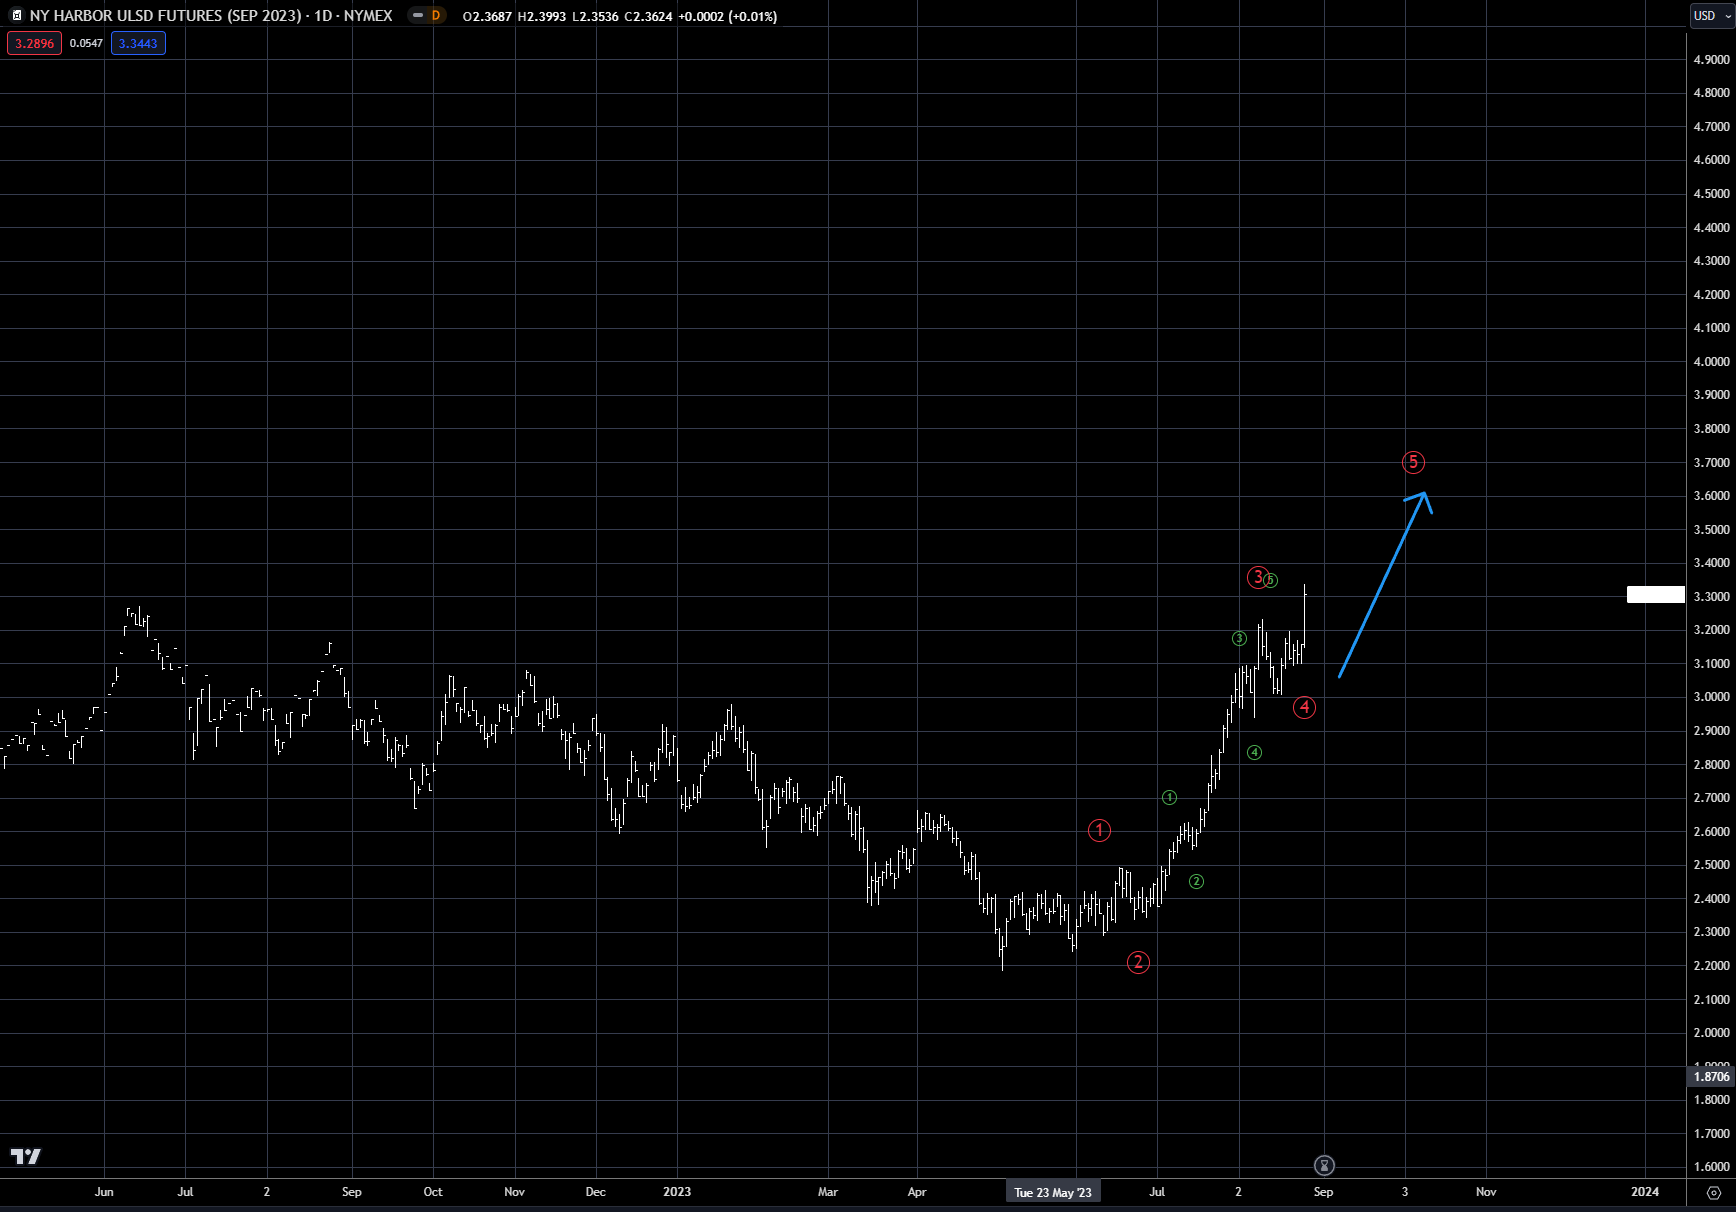
In energy last week a large fire at a major refinery pushed up gasoline and diesel fuel by 3-5% on Friday. NY Harbor ULSD (diesel) September contract has now rallied from $2.25 a gallon to over $3.25, an almost 50% increase in price. Gasoline prices basis the RBOB September contract have rallied from $2.25 to just under $3.00 a gallon. The September contracts expire this week, and the product tightness due to the refinery fire could cause some fireworks for nearby supply. See charts 4 and 5.
Chart 4 RBOB Gasoline September Contract
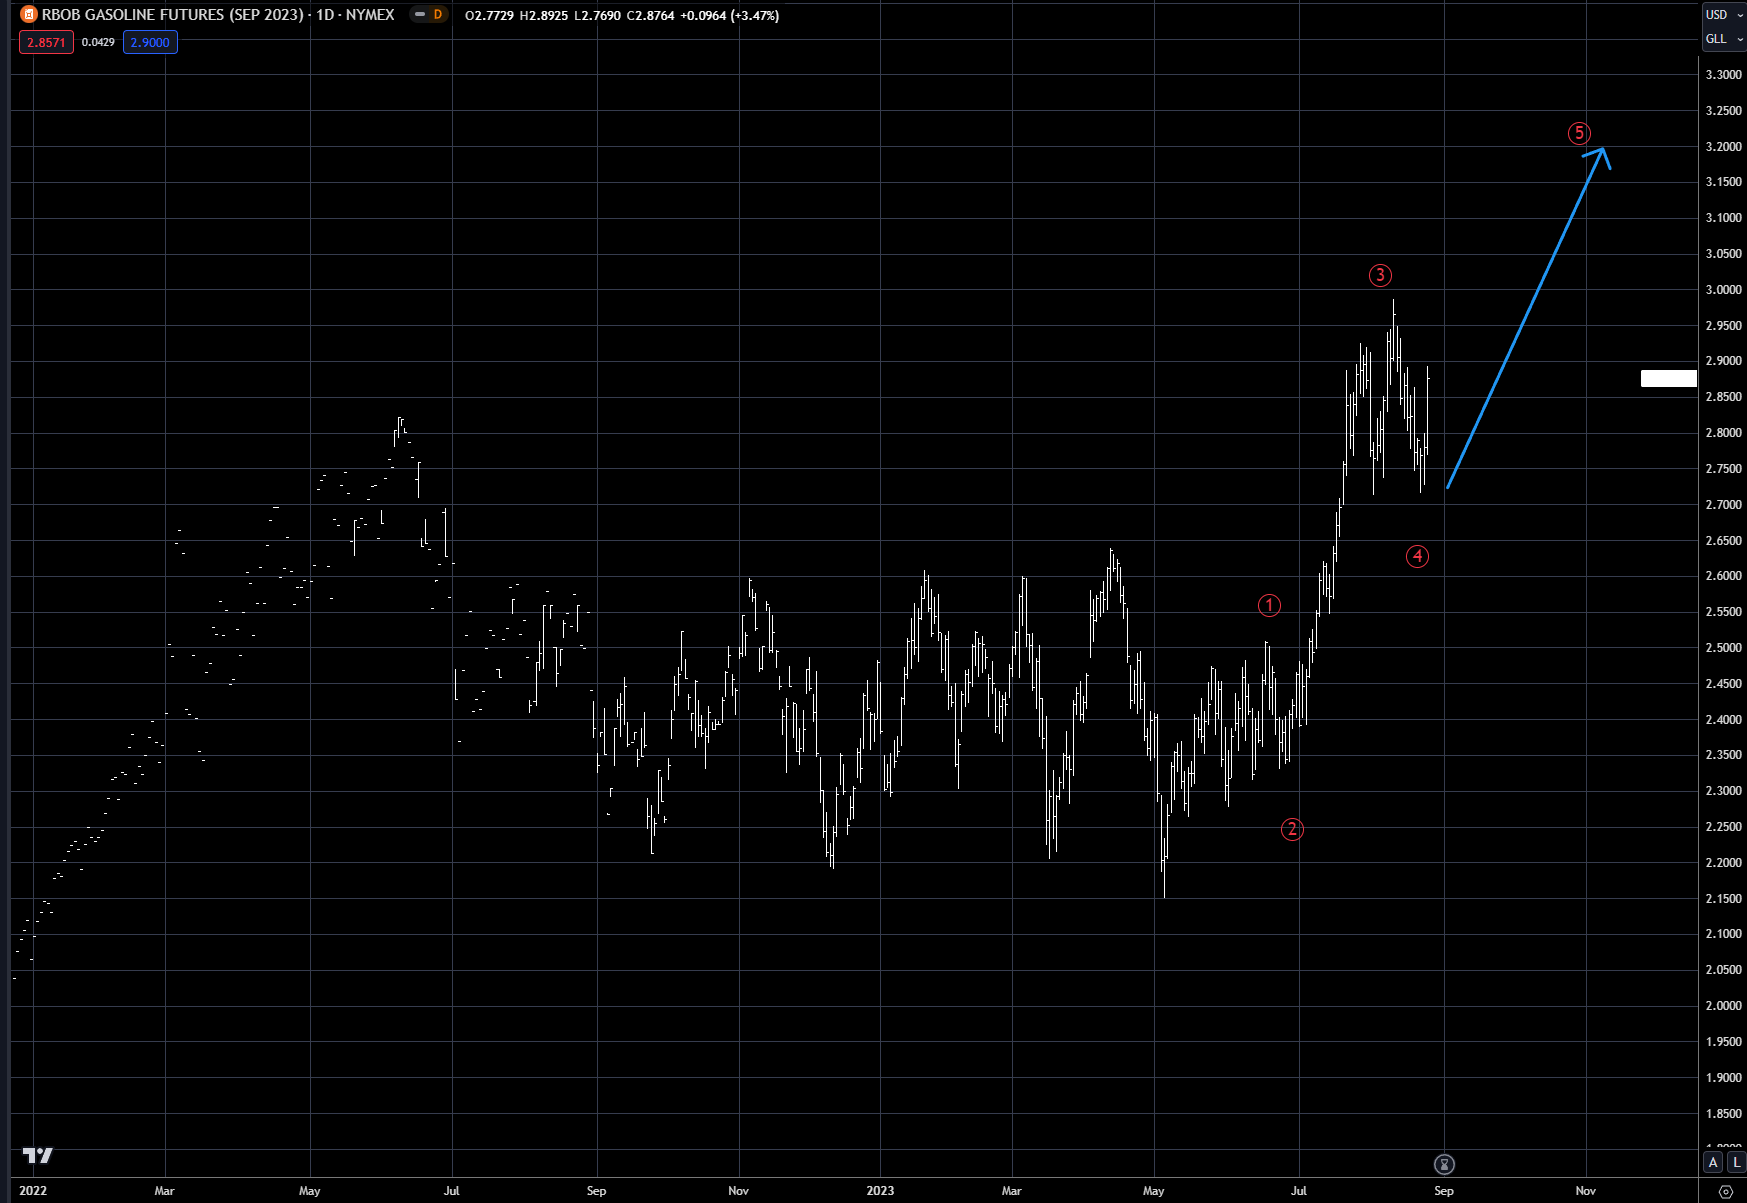
Chart 5 NY Harbor ULSD (Diesel)
Equities had a pretty volatile week with the market bouncing off its lows after Fed Chairman spoke on Friday, with his short speech being construed as hawkish, yet still in line with expectations. This meant NO surprises for the market and the Fed will continue to be data dependent. With energy prices rising dramatically, look for potential surprises in the CPI and PCE rates in the next few weeks.
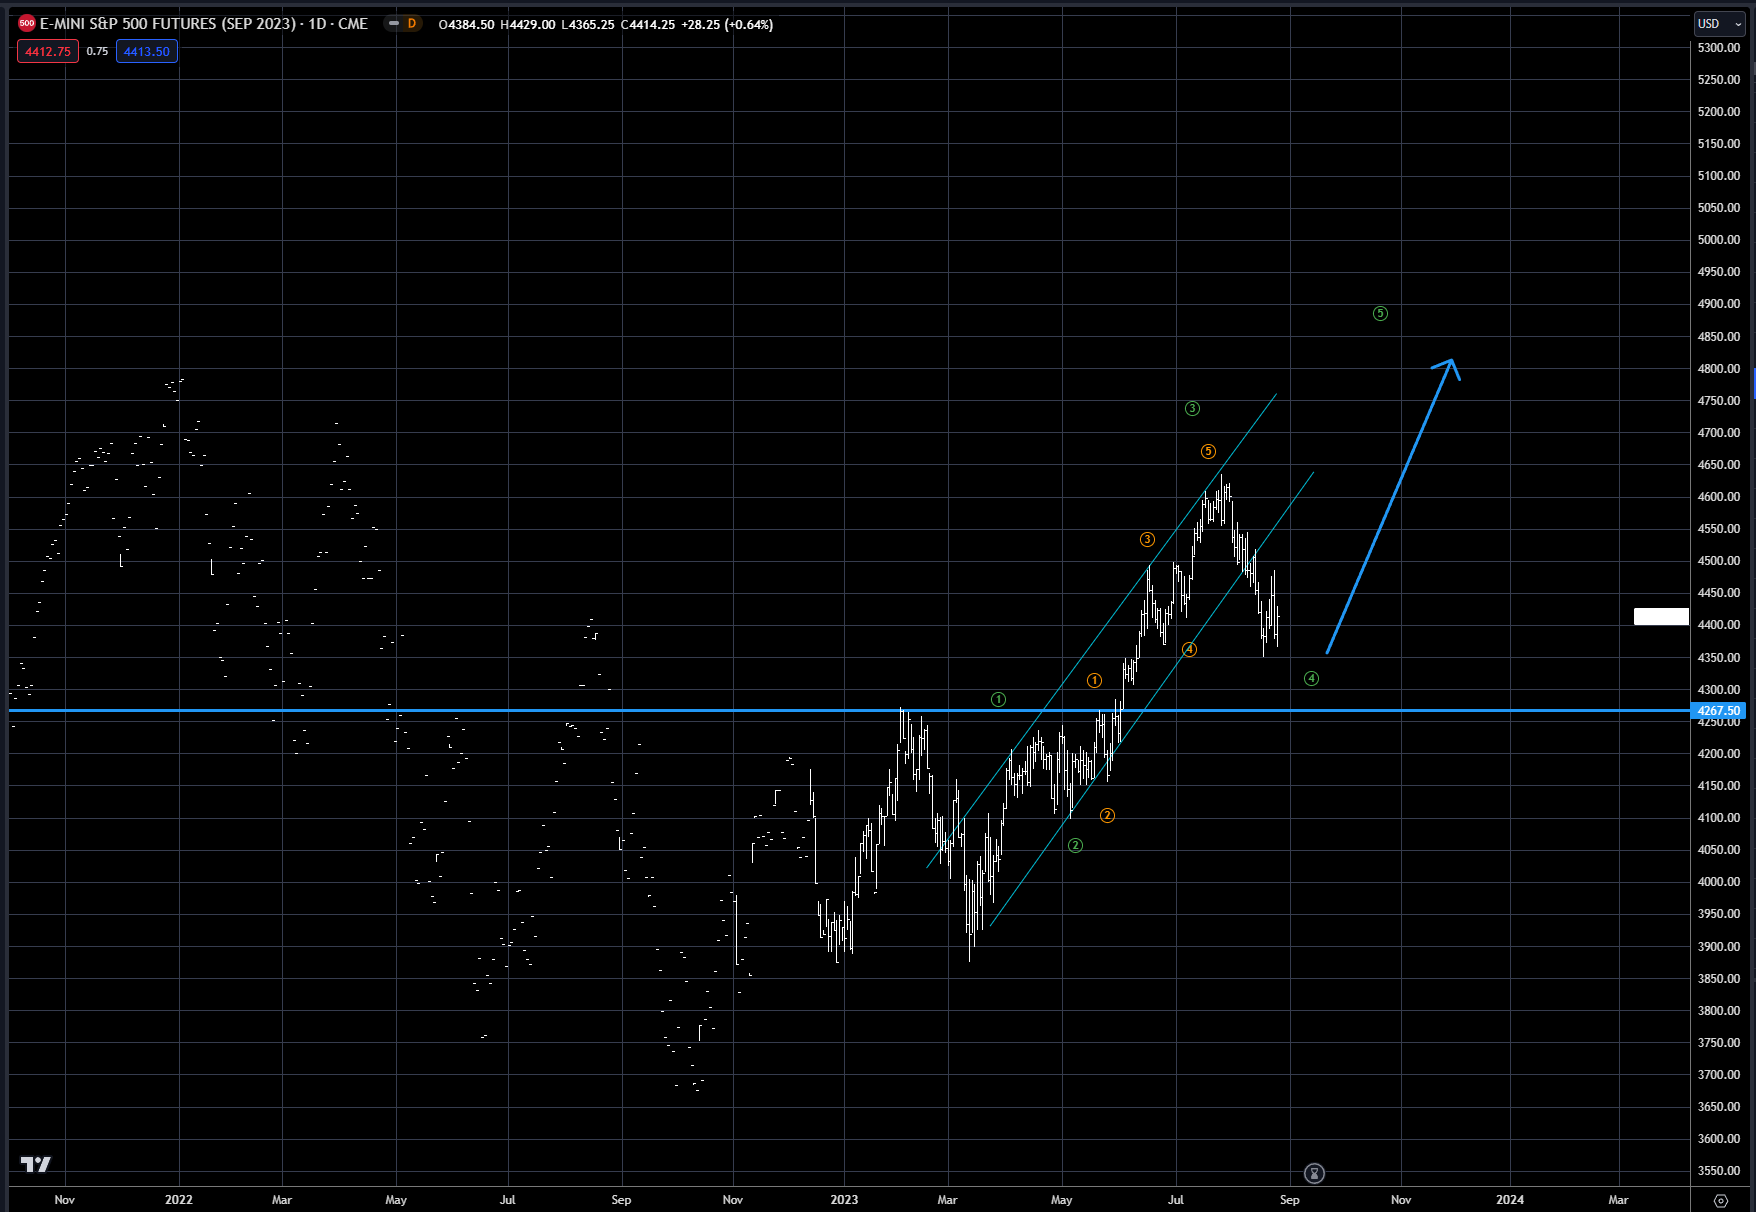
Equities basis the S&P500 have now declined about 5% over the past few weeks, but the corrective phase in still in progress. Our base case is still for another rally as shown in Chart 6. The point where the market gets worried about this upside target is a breach of the horizontal blue line near the 4250 level. In order to argue that another leg up is possible, this low must hold on the current corrective phase.
Chart 6 S&P 500 September Futures
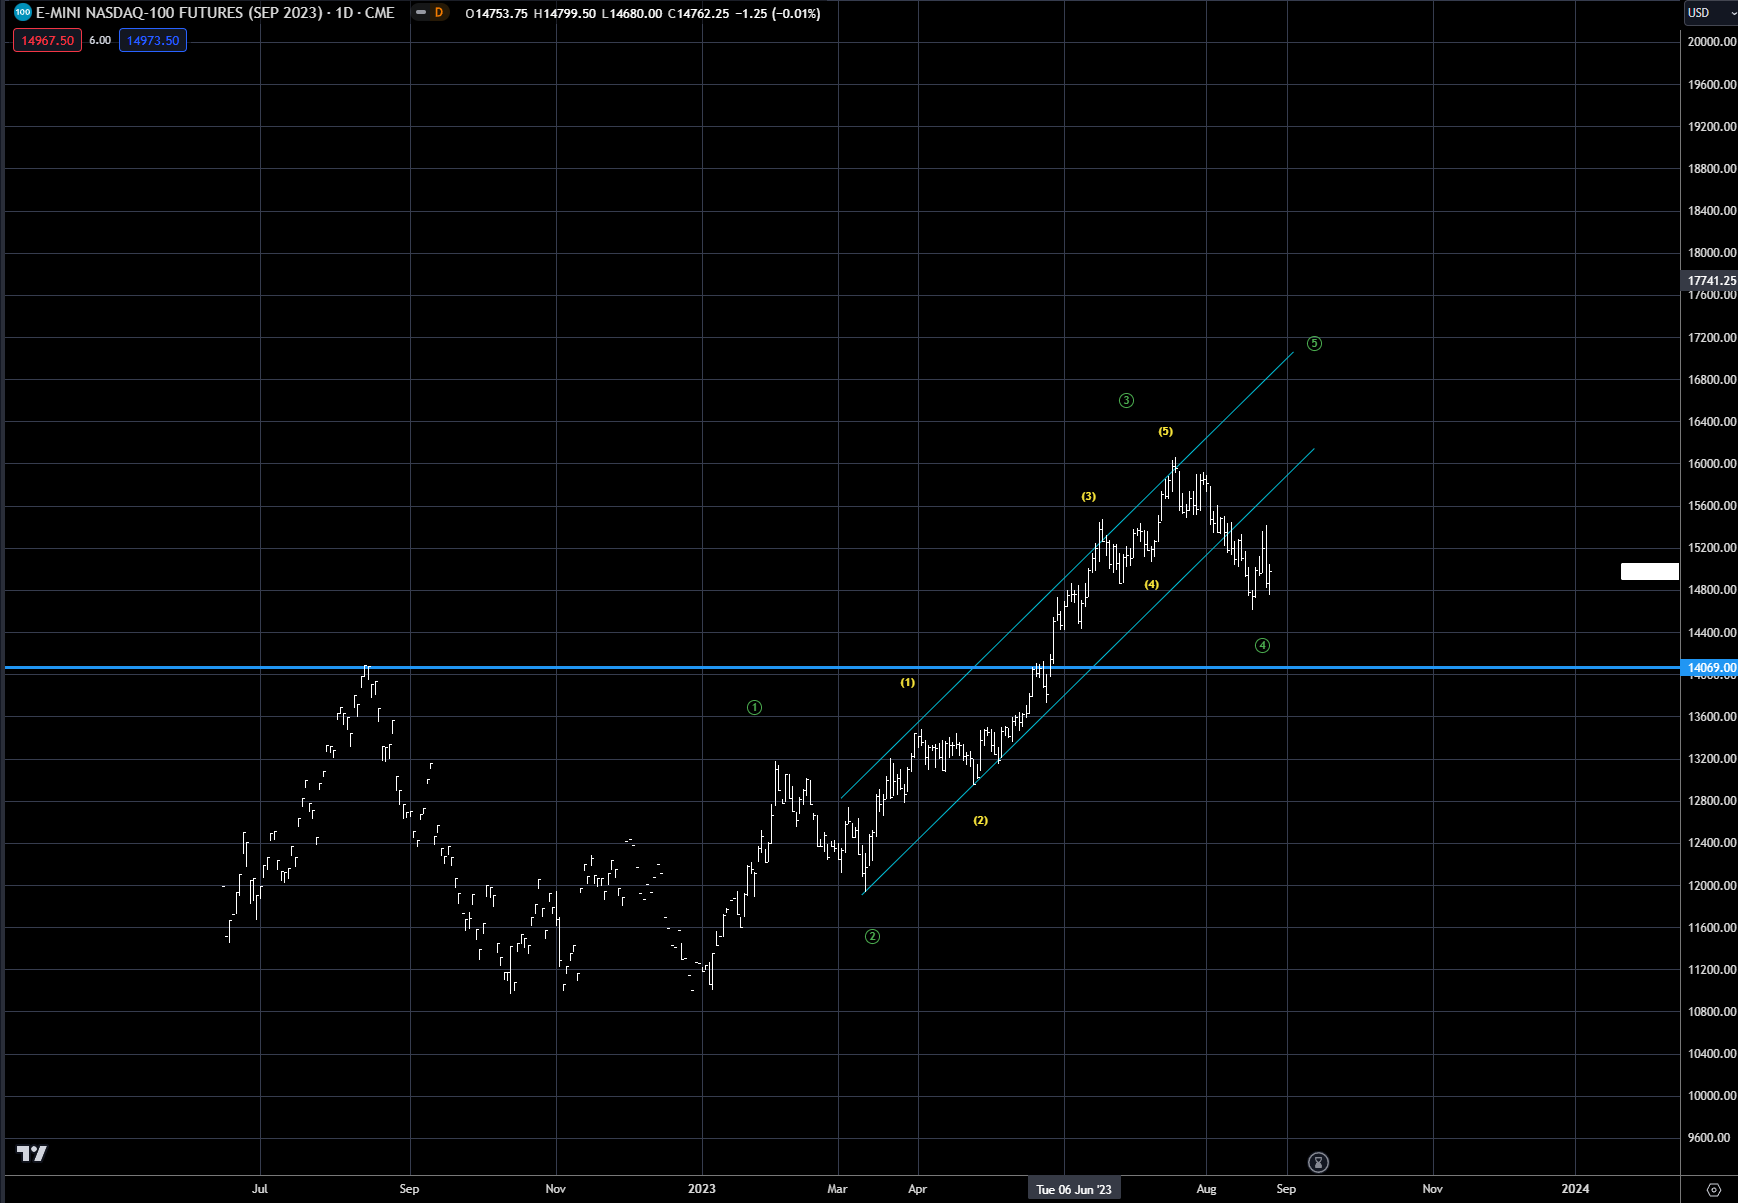
The Nasdaq correction has been a bit larger than the S&P, with the decline about 9% over the past few weeks. Chart 7 shows that the channel discussed in earlier updates, has now been broken—confirming the end of the third wave. The best support is the horizontal blue line around the 14000 level, which is a good area for the corrective phase to pause, prior to another leg up. If this support level can hold, the last leg up could test the highs from last year. A breach of this support level, opens the door for a larger sell-off.
Chart 7 Nasdaq September Futures
Precious metals had a nice bounce off the lows last week, with silver outpacing gold for the week. Out base case is still the scenario outlined in our Gold report last week.
Trading strategy is based on the author's views and analysis as of the date of first publication. From time to time the author's views may change due to new information or evolving market conditions. Any major updates to the author's views will be published separately in the author's weekly commentary or a new deep dive.
This content is for educational purposes only and is NOT financial advice. Before acting on any information you must consult with your financial advisor.
