Inflation in Focus
Author: Bruce Liegel
This week’s CPI report data was in line with market forecasts and consensus views, but core CPI continues to be quite sticky. While overall CPI is down to 3.2%, core is still quite elevated at 4.7% and is driving fears that the Federal Reserve will have to maintain a tightening bias longer and higher than expected.
This is causing reverberations in equities as the market correction we have been talking about appears to be starting, with the main drivers of the bull market turning over and breaking out of the channel patterns exhibited in our previous weeklies.
Chart 1

Since as long as I have been in markets, core inflation has always been the main focus as energy and food prices were always considered too volatile to be relevant over a short period of time. Many have been arguing to only look at the overall rate and ignore the core rate because this has fit their bullish thesis. I think the market is now going to focus more on the core rate, which could also pressure the long end of the curve, pushing rates higher as has been previously discussed.
Core inflation is highly correlated to wage inflation, as documented in chart 2. Higher wage pressure going forward, based on immigration and an aging workforce, is an issue, as outlined in our deep dive The End of Cheap Labor a few months ago. This major trend will continue to drive wage pressure over the next decade, putting a floor in the core inflation growth rate above the 3% level.
Chart 2
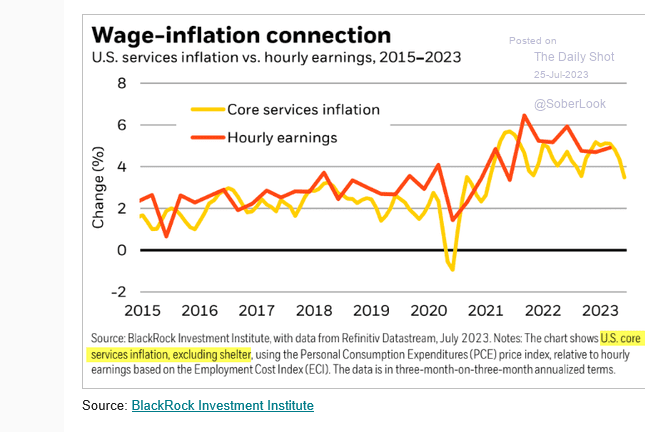
Chart 3 really digs into what is going on with the core rate, as the services component is clearly 'sticky' versus the food and energy components. Chart 4 goes into what is in the core-services component and does a nice job breaking out the key aspects of the basket.
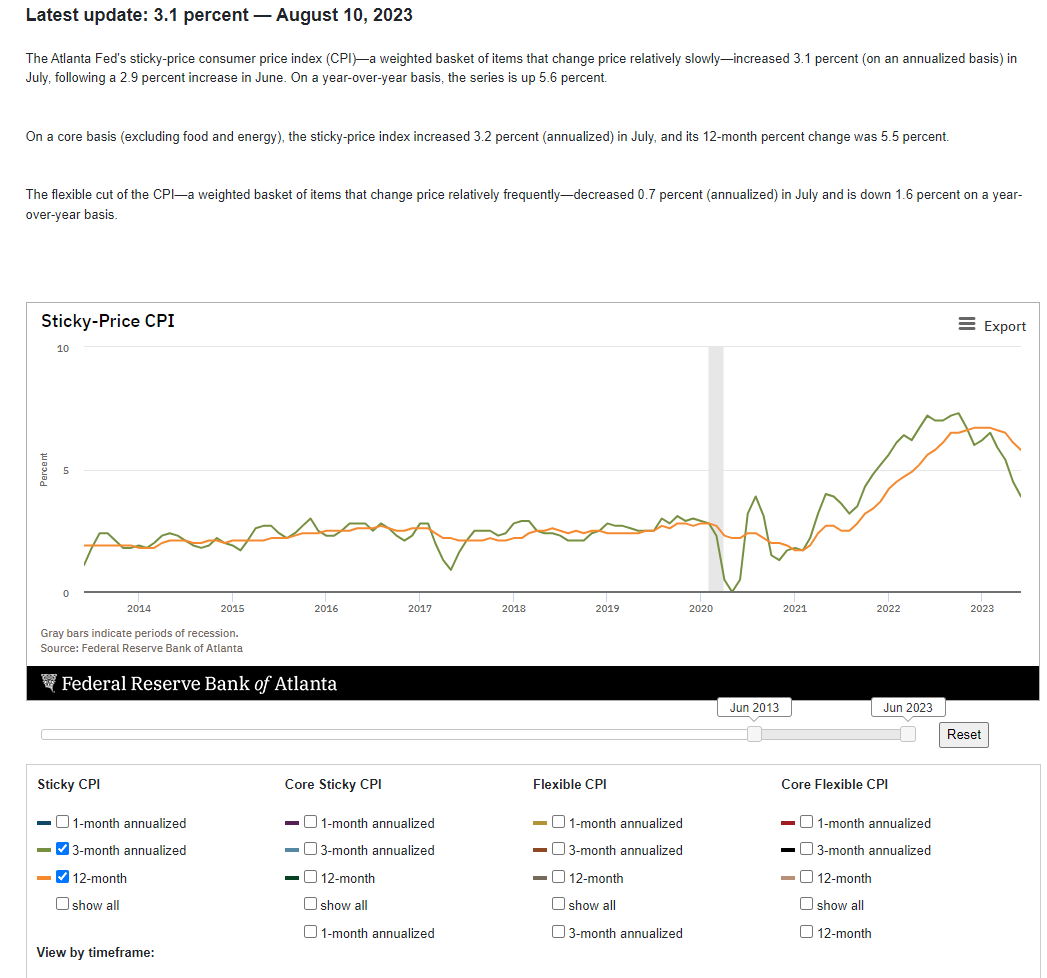
In chart 5, the Atlanta Fed actually has an index called the The Atlanta Fed Sticky CPI Index, which allows you to change the time frame and type of CPI used in the analysis. The box on the bottom of the chart shows these options. On a core basis, excluding food and energy, the sticky price index increased 3.2% in July and the 12-month change was 5.5%. This 12-month change will keep the Fed on a more hawkish watch going forward, as their fear is that if they begin easing too early, it will allow for the next wave of inflation to dig in, a la 1970s.
Chart 3
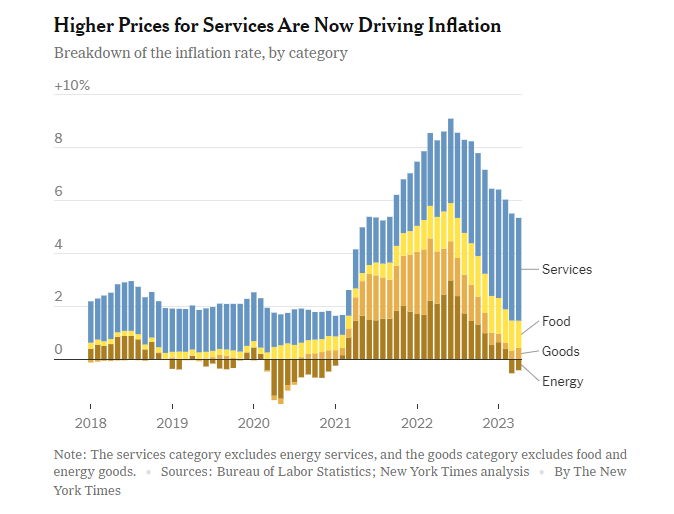
Chart 4
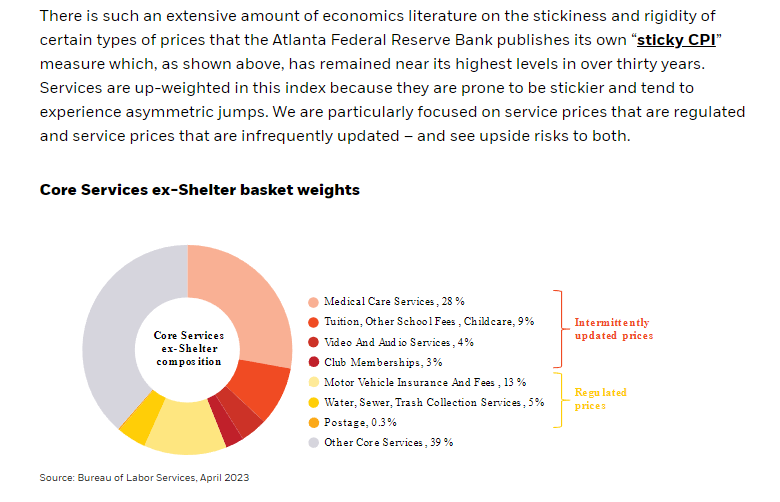
Chart 5: The Atlanta Fed Sticky CPI
Transportation has been one of the key drivers for inflation over the past couple years. Chart 6 below shows the price history for the Baltic Dry (food) index, with the price sharply lower from the October 2021 high. The cost of shipping food is now close to the levels seen over the last 20 years. Although the index is rising slightly this year, it will not be a driver in the short term for higher inflation, unless we see an exogenous event occur. (Think Russia and Ukraine exports).
Chart 7 shows the cost of shipping grain via the Mississippi River in the US, the main export artery for shipping corn and soybeans to world markets. It also is well off its highs, and will have minimal impact on inflation in the short run.
Chart 8 shows the global container-rate market, and just like the previous two charts, the rates are significantly lower than the 2021 highs.
Chart 6: Baltic Freight Dry Index

Chart 7: Barge freight in the US
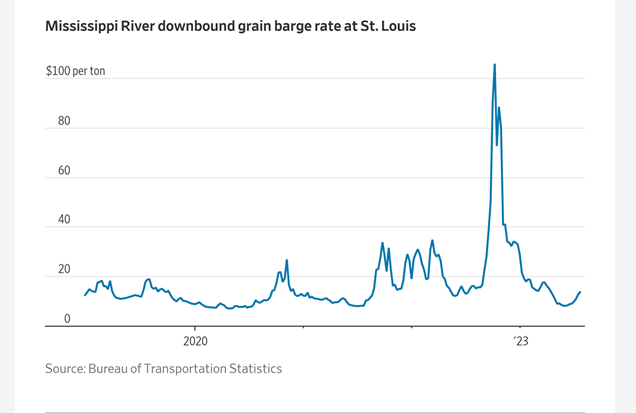
Chart 8

To finish up the conversation on shipping costs, chart 9 shows the overall costs for shipping freight in the US, via the Cass Freight Index. While the overall cost is declining, it is still running at over a 3% annual rate, and above the last 10-year average of about 2-2.25%. So, yes it could and will be sticky! (Think union wage negotiations).
Chart 9

In charts 10 and 11, the cost of shipping oil globally is shown using the VLCC (Very Large Crude Containers) rates from different locations. Overall rates are sharply lower since the start of 2023, even with the Russian conflict. Obviously, this can be a very volatile segment of the transportation sector and merits watching closely, but for now it is more of a cost reduction versus a cost driver.
In review, while transportation costs were a major driver in the spike of inflation during 2021-22, year-over-year changes are much lower now. But I would argue, there will be a limit to how much lower they go in both the short and long term, due to demographics and immigration.
Keep in mind that the reduction in globalization and the decline in the pace of China's economic growth will also keep a cap on inflation spiking again in the short term – six months to a year. China is slowing dramatically and appears to be having credit issues also, and this will weigh on the global economy. This all suggests that any reignitions of inflation may not be for a year or two from now.
Chart 10: Oil tanker rates

Chart 11: More oil shipment rates

Appendix:
S&P GSCI Index - up 13% since the June low


FAO Food Price Index

Trading strategy is based on the author's views and analysis as of the date of first publication. From time to time the author's views may change due to new information or evolving market conditions. Any major updates to the author's views will be published separately in the author's weekly commentary or a new deep dive.
This content is for educational purposes only and is NOT financial advice. Before acting on any information you must consult with your financial advisor.
