This Week in Global Macro (July 17)
Author: Bruce Liegel
Last week's US CPI data was the market mover and came in just slightly lower than expected, but enough to temporary give the green light for risk on trades. US 10-year rates pretty much did a round trip, wiping out the yield increase from the previous week, as shown in Chart 1 below.
The long-term pattern is still in play, with the likely scenario that rates will make a new high before the pattern is complete. But, as I cautioned last week, the last leg is also the riskiest, with a lot of potential volatility and wild rate swings based on changes in market positioning.
Chart 1: US 10-year weekly chart

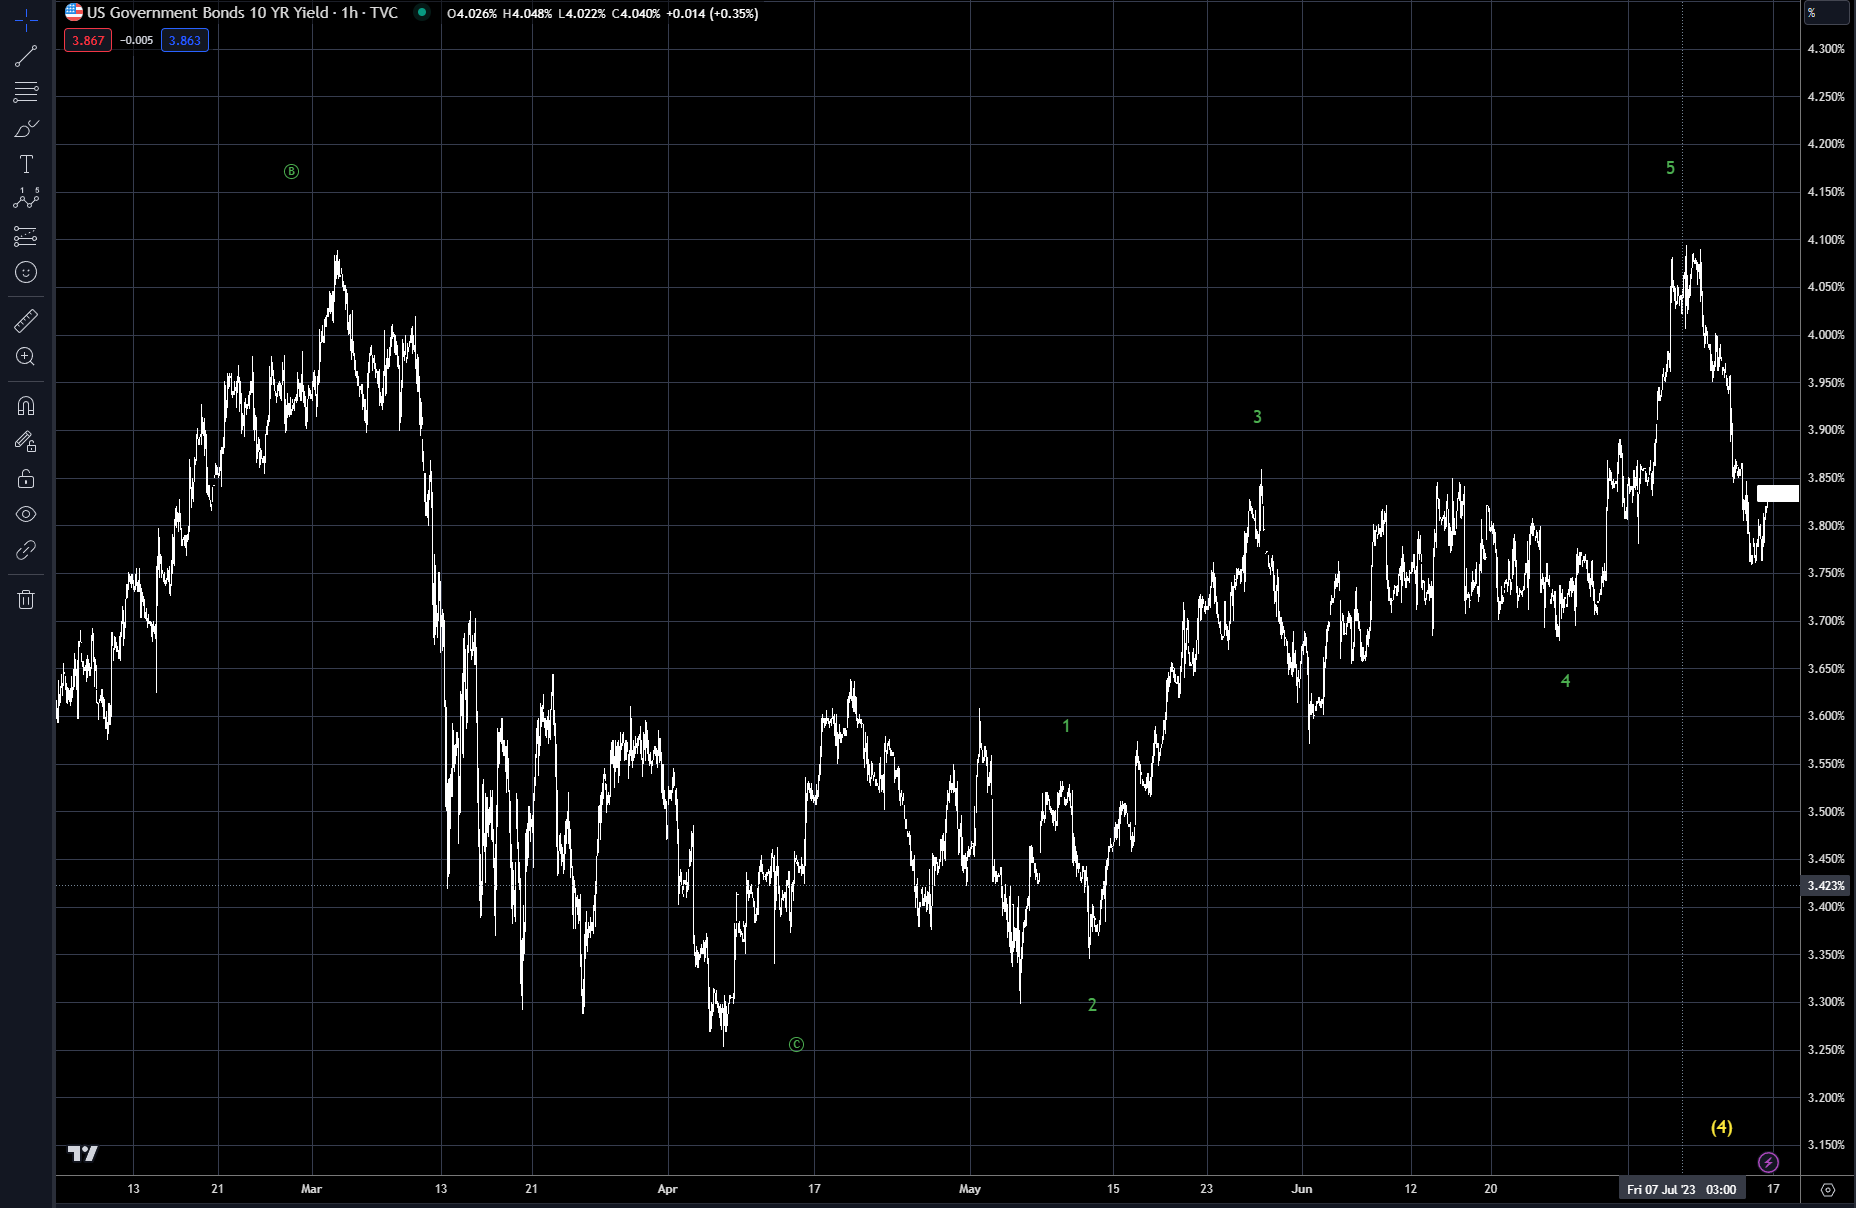
In chart 2, the intraday pattern for the US 10-year shows a clear 5 wave completion (in green), which could be argued as completion of the overall pattern from the 2020 low. But that might be premature as last month’s CPI data may be the low for the year. With that argument, the intraday pattern in Chart 2 would have only marked the first wave of the final wave (5), with two more sub-waves up to complete the final wave (5). NET NET, I’m saying there is more upside potential before the market tops.
Chart 2—US 10-year intraday chart
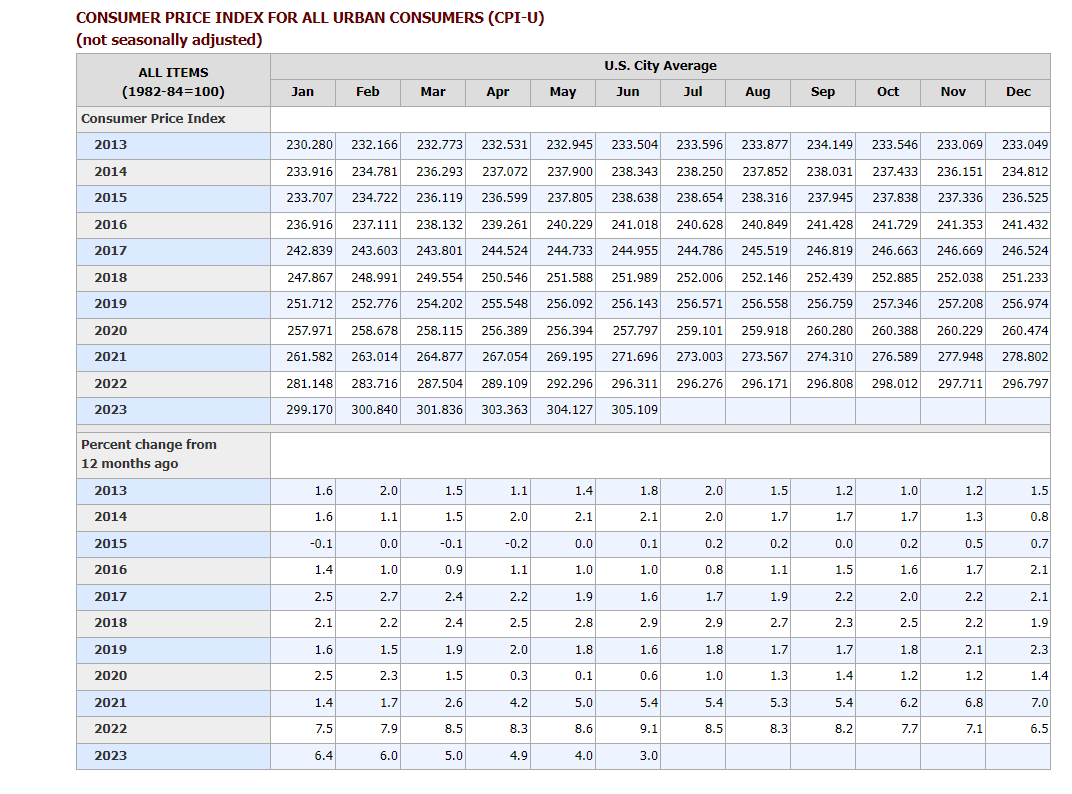
In Chart 3, the CPI index data along with the CPI % is shown. This data is key for the argument that last month's CPI data might be the low for the rest of 2023. Remember that CPI is a year-over-year change, and is mathematically compared with the index value from this year versus last year.
Notice that for the last half of 2022 the index was flat – it was 296 in July and 296 in December – and inflation fell from 8.5% to 6.5%. With inflation currently running at 3% in June, a static inflation rate for the rest of the year will actually increase the year-over-year rate, making the June rate of 3% the low of the year. The market has not priced this scenario in and it makes perfect sense for our interest-rate outlook. This will also keep the Fed in a restrictive mode, with at least 2-3 hikes left this year.
Chart 3: CPI index analysis
Crestmont research has done some in-depth studies on this very topic and the data is shown in Chart 4. Their research shows the potential glidepath for inflation for the balance of 2023. Notice the green line at the bottom with the potential glidepath, based on a static 3% inflation rate (top in red), for the balance of 2023. One could argue that inflation will trend below 3%, but with oil firming back up, and the overall commodities (gold too) picture bottoming, headwinds are there to NOT allow inflation to go much lower this year.
Chart 4: More on inflation
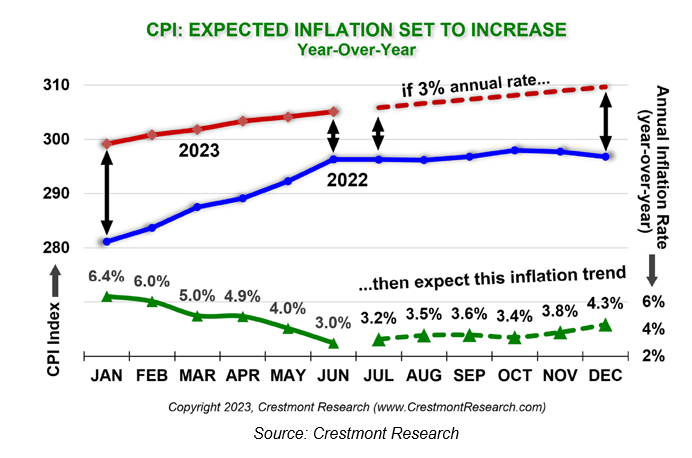
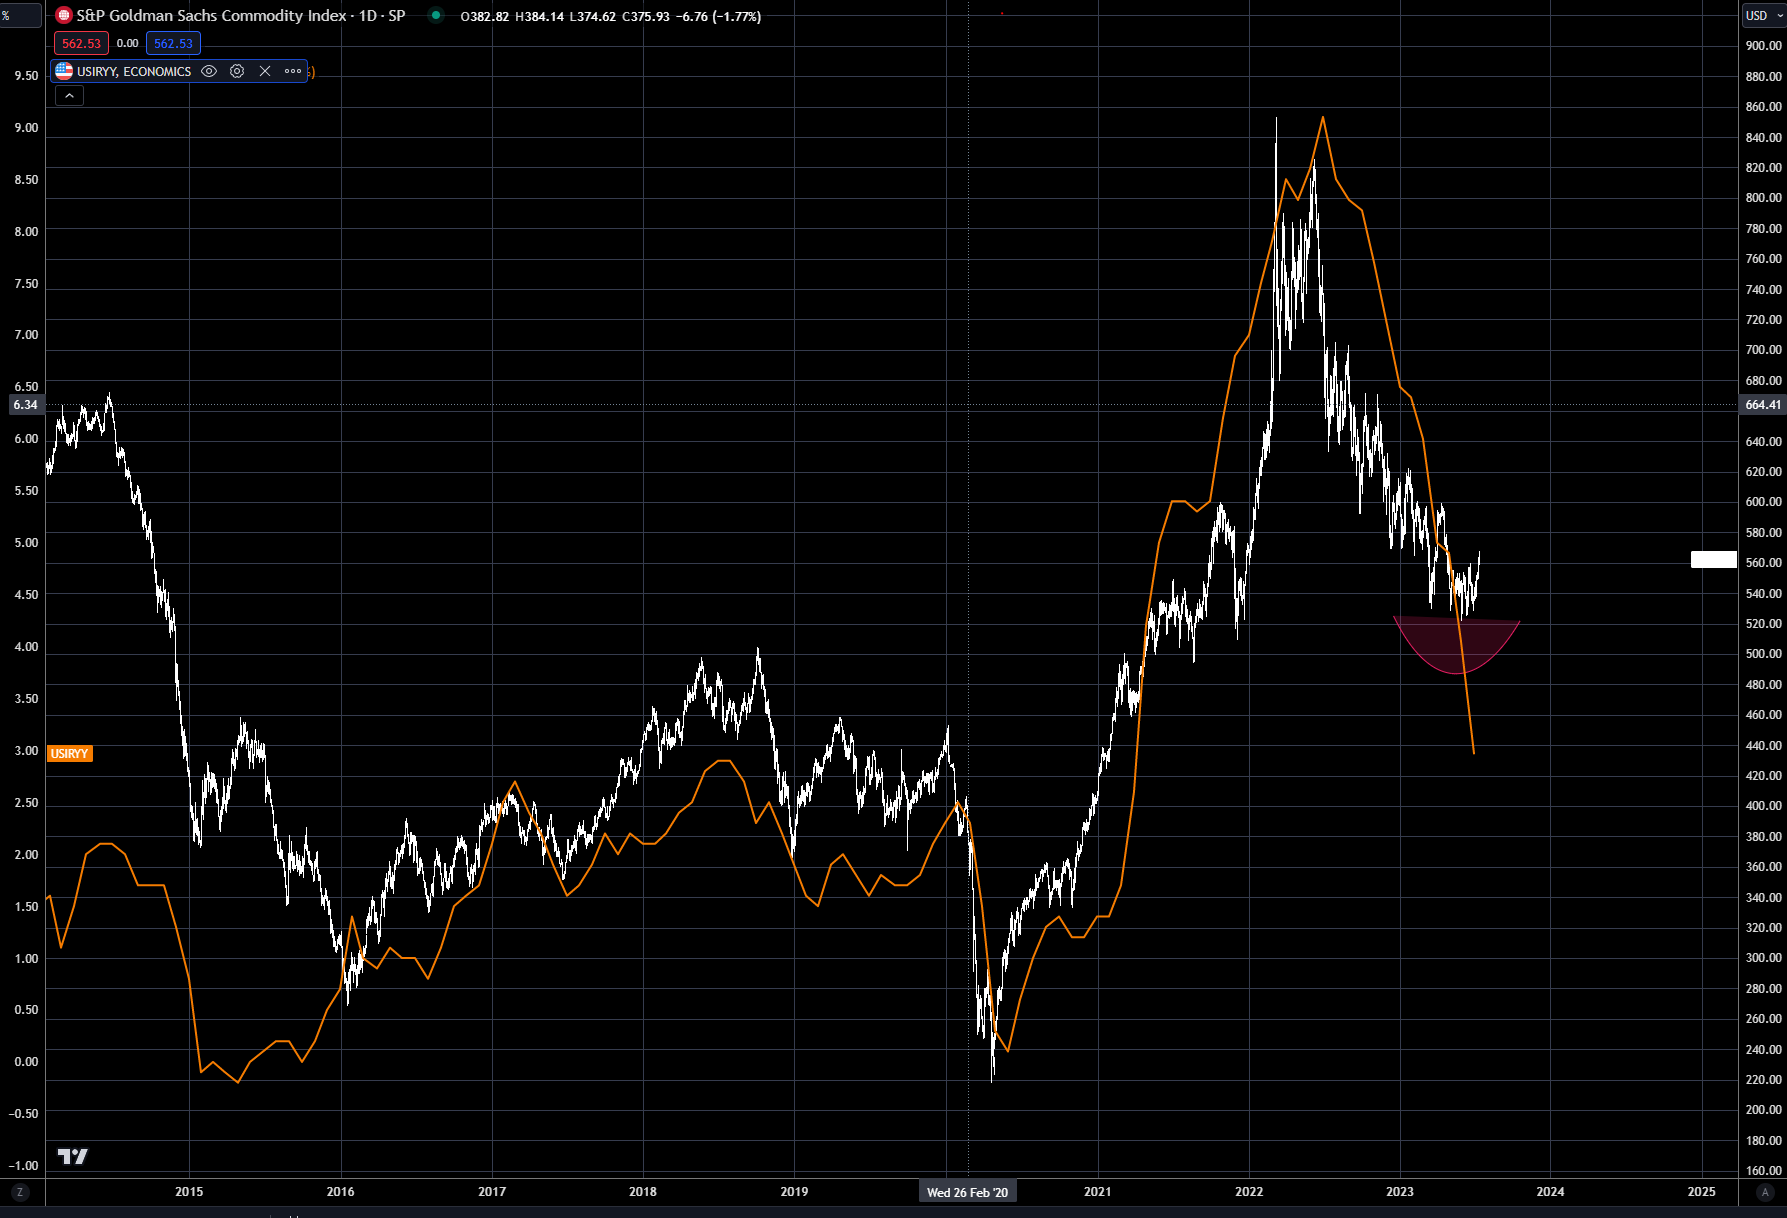
Chart 5 show the GSCI commodity index overlaid with the US CPI rate. CPI is the orange line and has been quite correlated with commodities (white bars) for the past 8-10 years in this graph. I would argue that the commodity index is digging in and making a bottom, which will end up turning the CPI index back up in the next 30-90 days. I have added a red arc, indicating the bottoming price action that is in place.
Chart 5: S&P Goldman GSCI Commodity Index – overlay with CPI
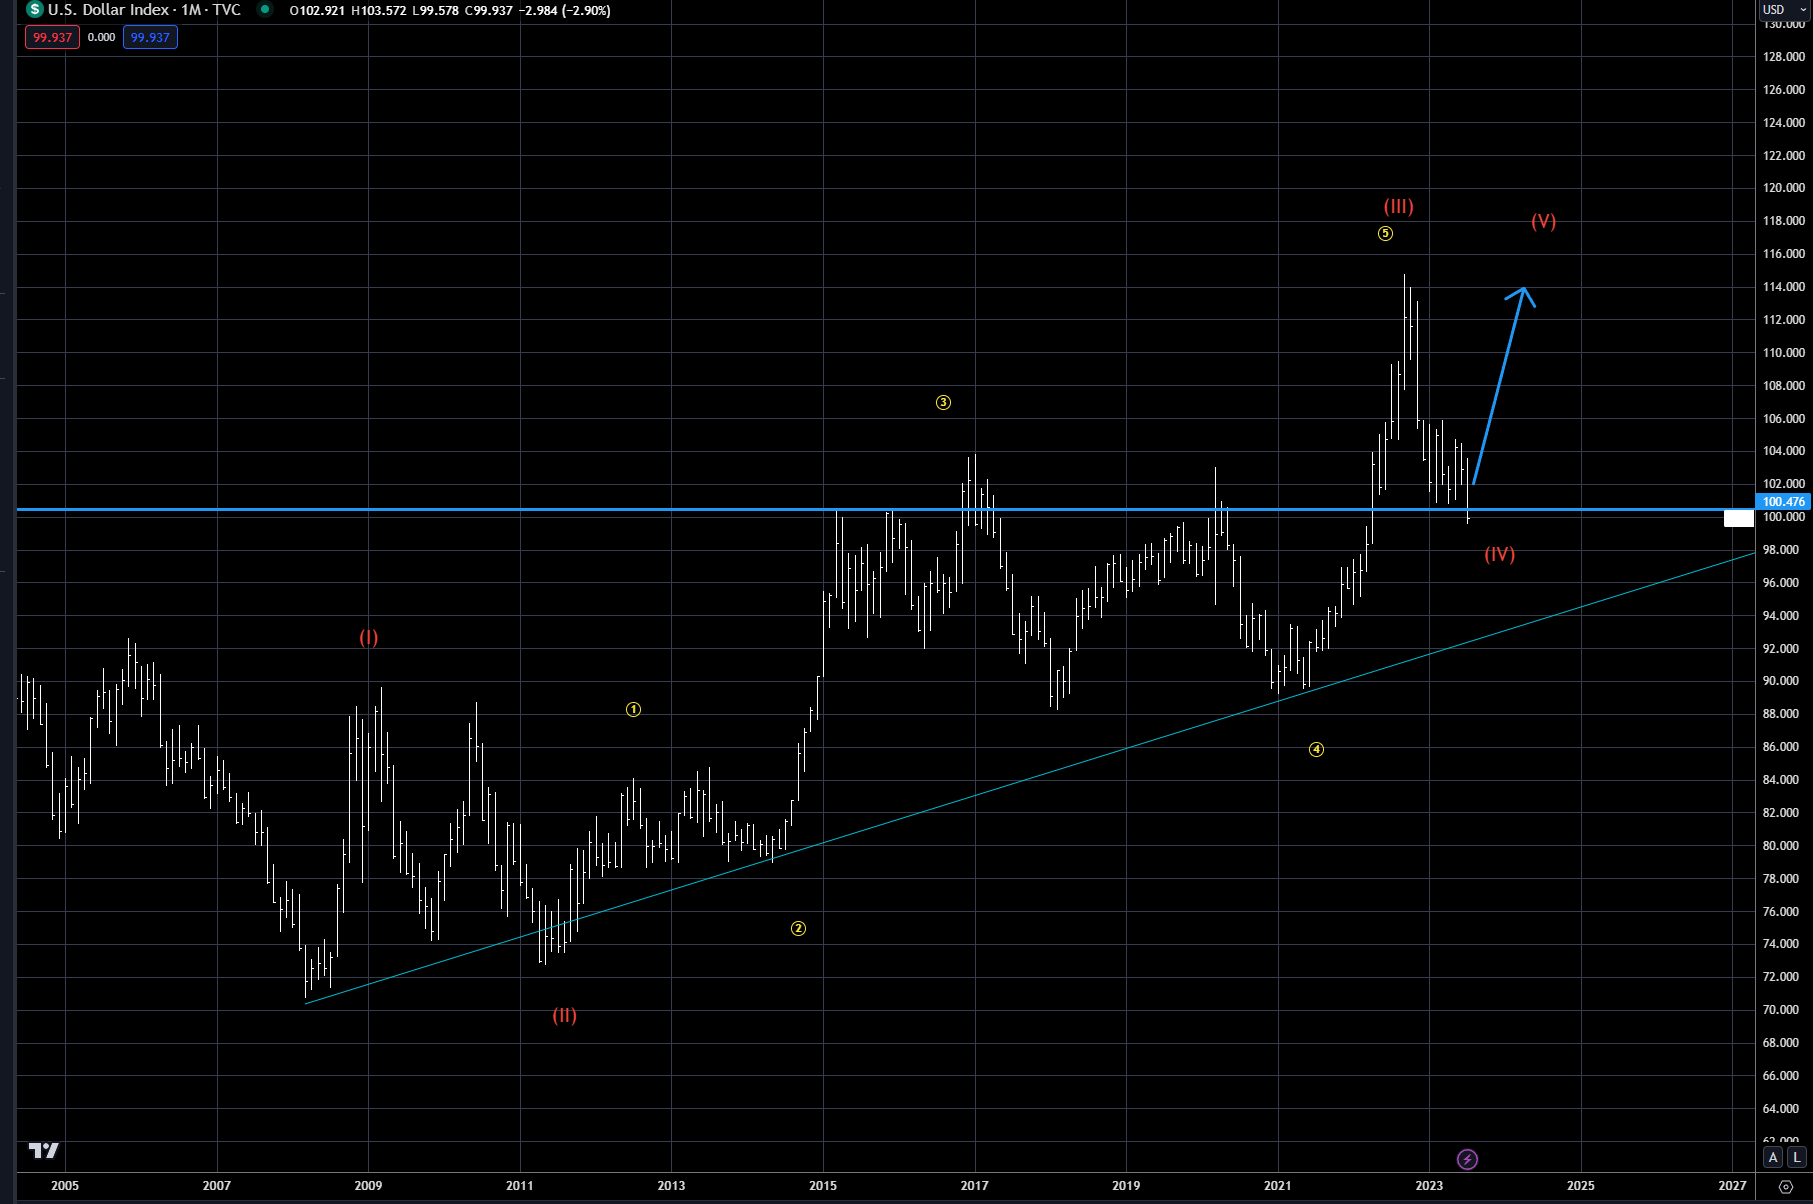
The dollar took it on the chin last week as the Dollar (Dxy) Index dug into the key support level near 100. Please see Chart 6. Technically the index could go down to the main trend line from the 2007 low and still be in a bullish posture, BUT ideally it should hold this week to keep the upside wave 5 in play.
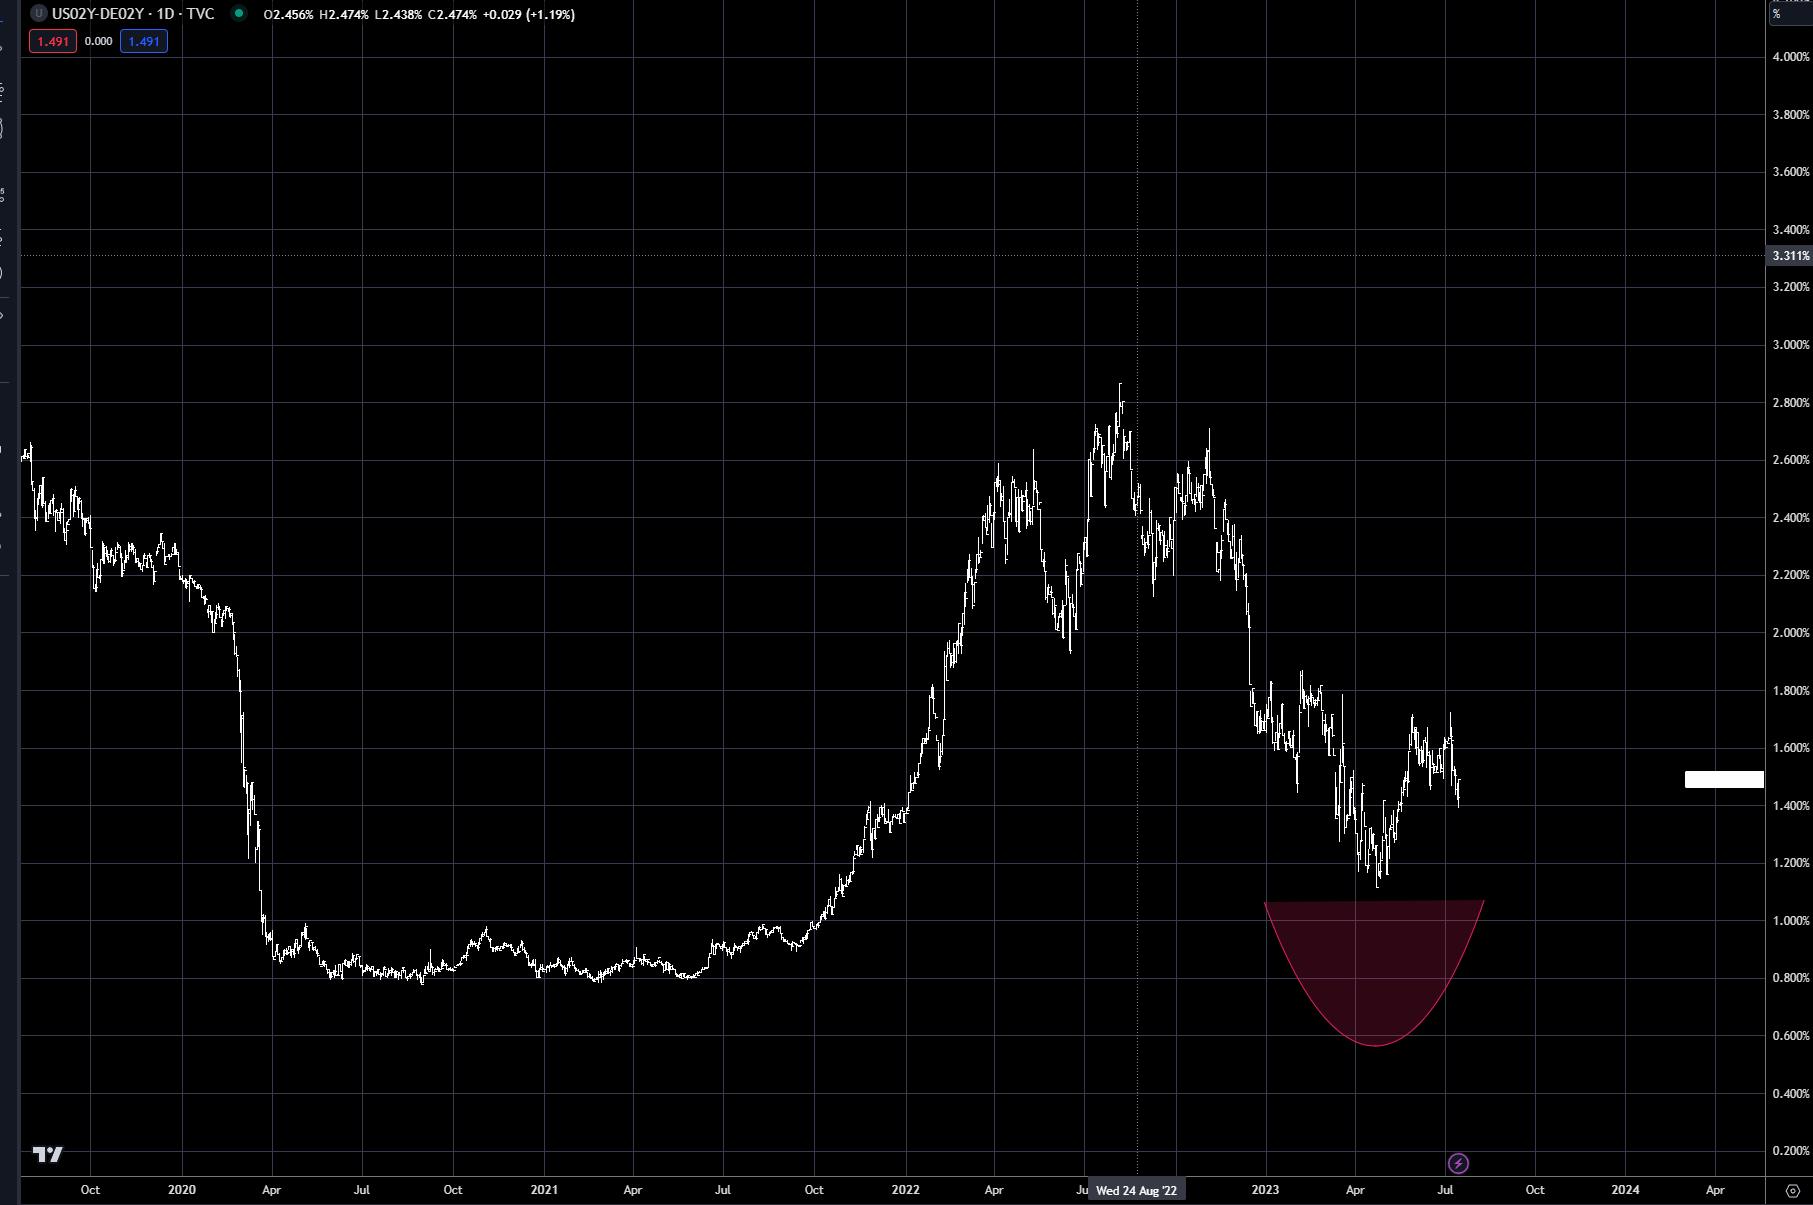
The 2-year rate differential between Germany and the US weakened last week, the main driver for the dollar sell-off (see Chart 7). But the market had a nice reversal late Friday, setting up a potential bottoming pattern in the 1.40% area. What would cause the bottoming here? All the arguments we made earlier in regards to US CPI bottoming.
The market has priced in a dovish Fed, but has not priced in a dovish ECB – a switch to a more hawkish Fed because of stubborn CPI data will be supportive for the dollar. As a side note, the euro is getting close to reaching the .618 retracement level in the mid 1.12 area, which would be a logical place to find the next resistance. For now, I am going to watch how the dollar trades this week, and will update thoughts on positioning next week.
Chart 6: Dollar index
US 2-year rate verse Germany 2-year rate
Trading strategy is based on the author's views and analysis as of the date of first publication. From time to time the author's views may change due to new information or evolving market conditions. Any major updates to the author's views will be published separately in the author's weekly commentary or a new deep dive.
This content is for educational purposes only and is NOT financial advice. Before acting on any information you must consult with your financial advisor.
