This Week in Global Macro (July 24)
Author: Bruce Liegel
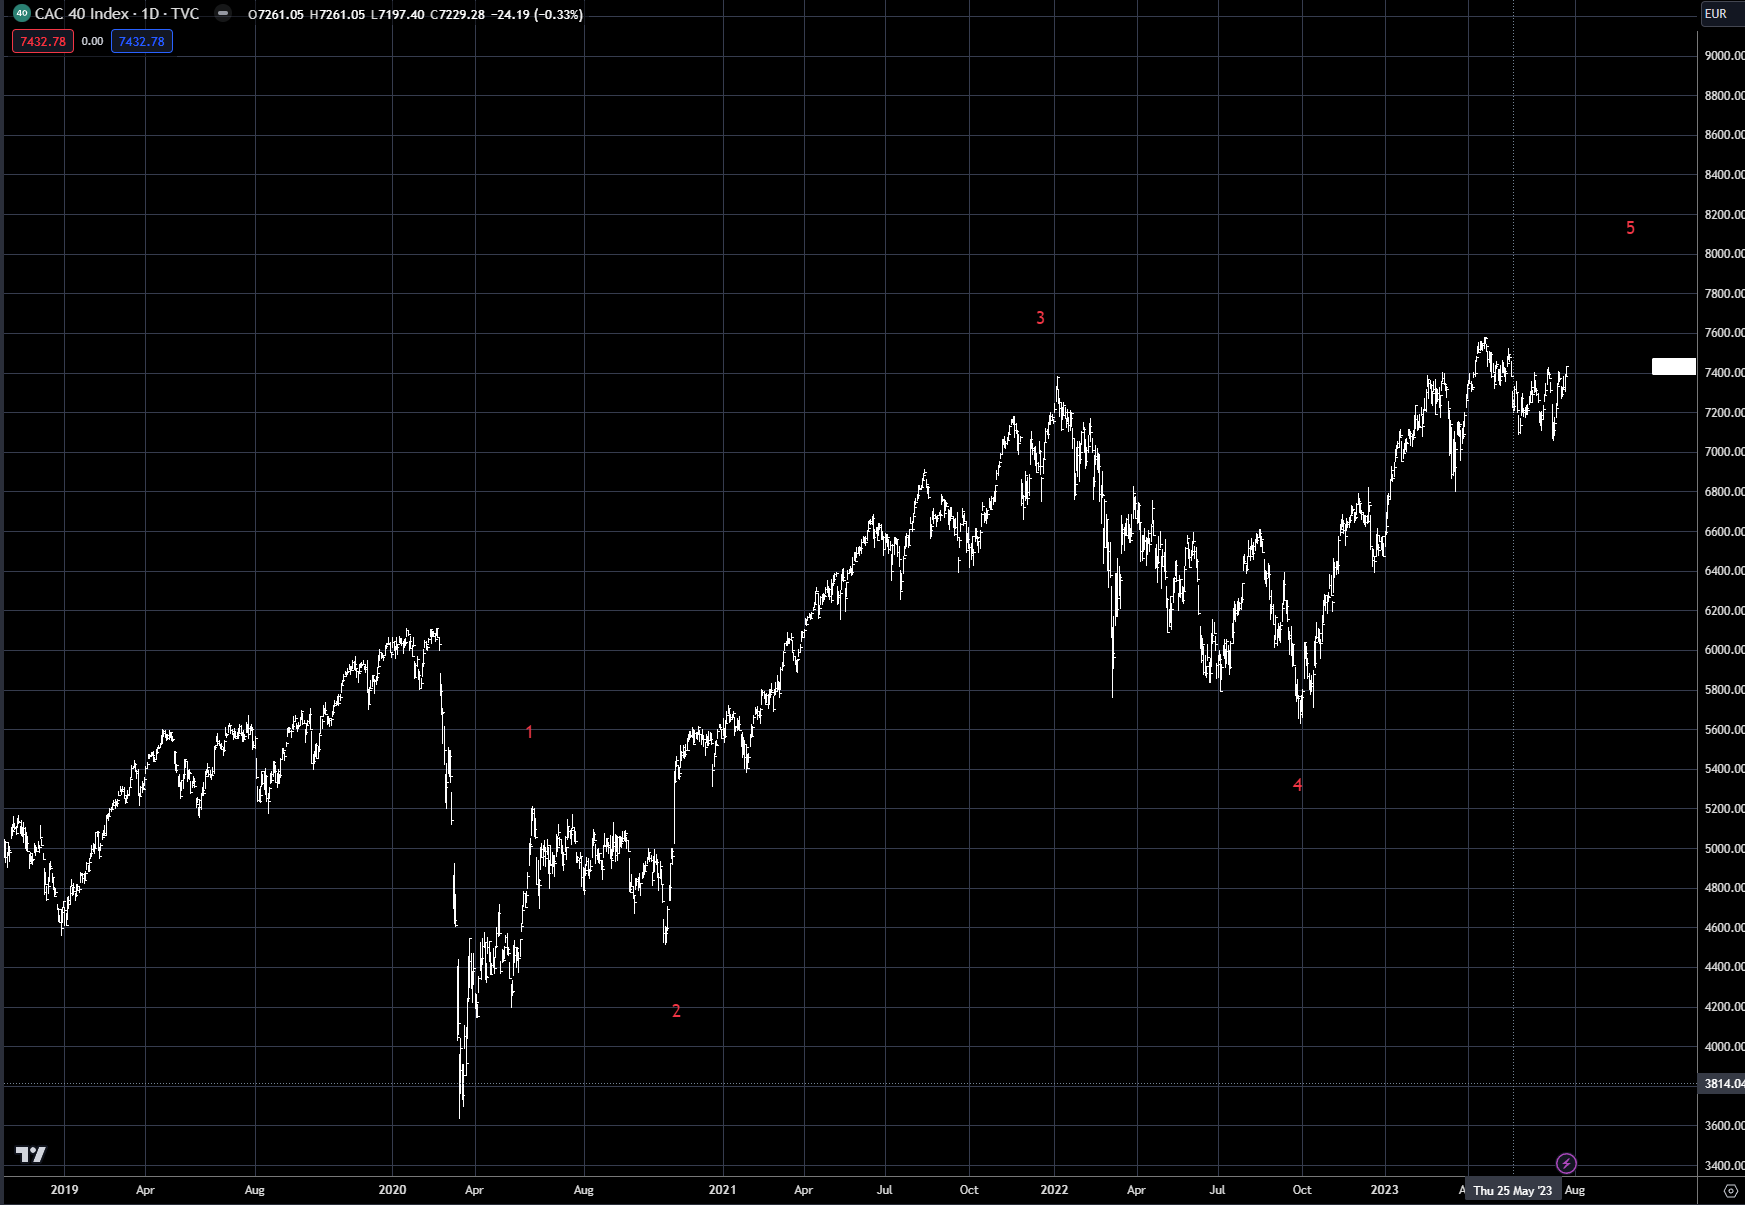
The European markets have continued to trade sideways, but may be setting up for a move towards new highs – possibly making new highs before the anticipated correction occurs.
Since the 2020 lows, the French CAC is still in a 5-wave sequence, with the final leg still in progress – leg 5. Over the past few weeks, the CAC has dug in at good support near the 7,000 level and has held, setting up the strong move last week. Overall, European economic news continues to indicate slower growth ahead, with inflation still somewhat sticky but falling. Wage pressure is still tight, with labor markets globally still searching for more workers.
French CAC
The German Dax has stubbornly held its ground the past few weeks above the 15,600 level, even as German economic issues have become more obvious. The anticipated easing of monetary policy sometime in the next 3-6 months has helped support global equity markets, as the easing cycle is getting priced in. The drop in the Dollar has also helped support European and Japanese stock markets.
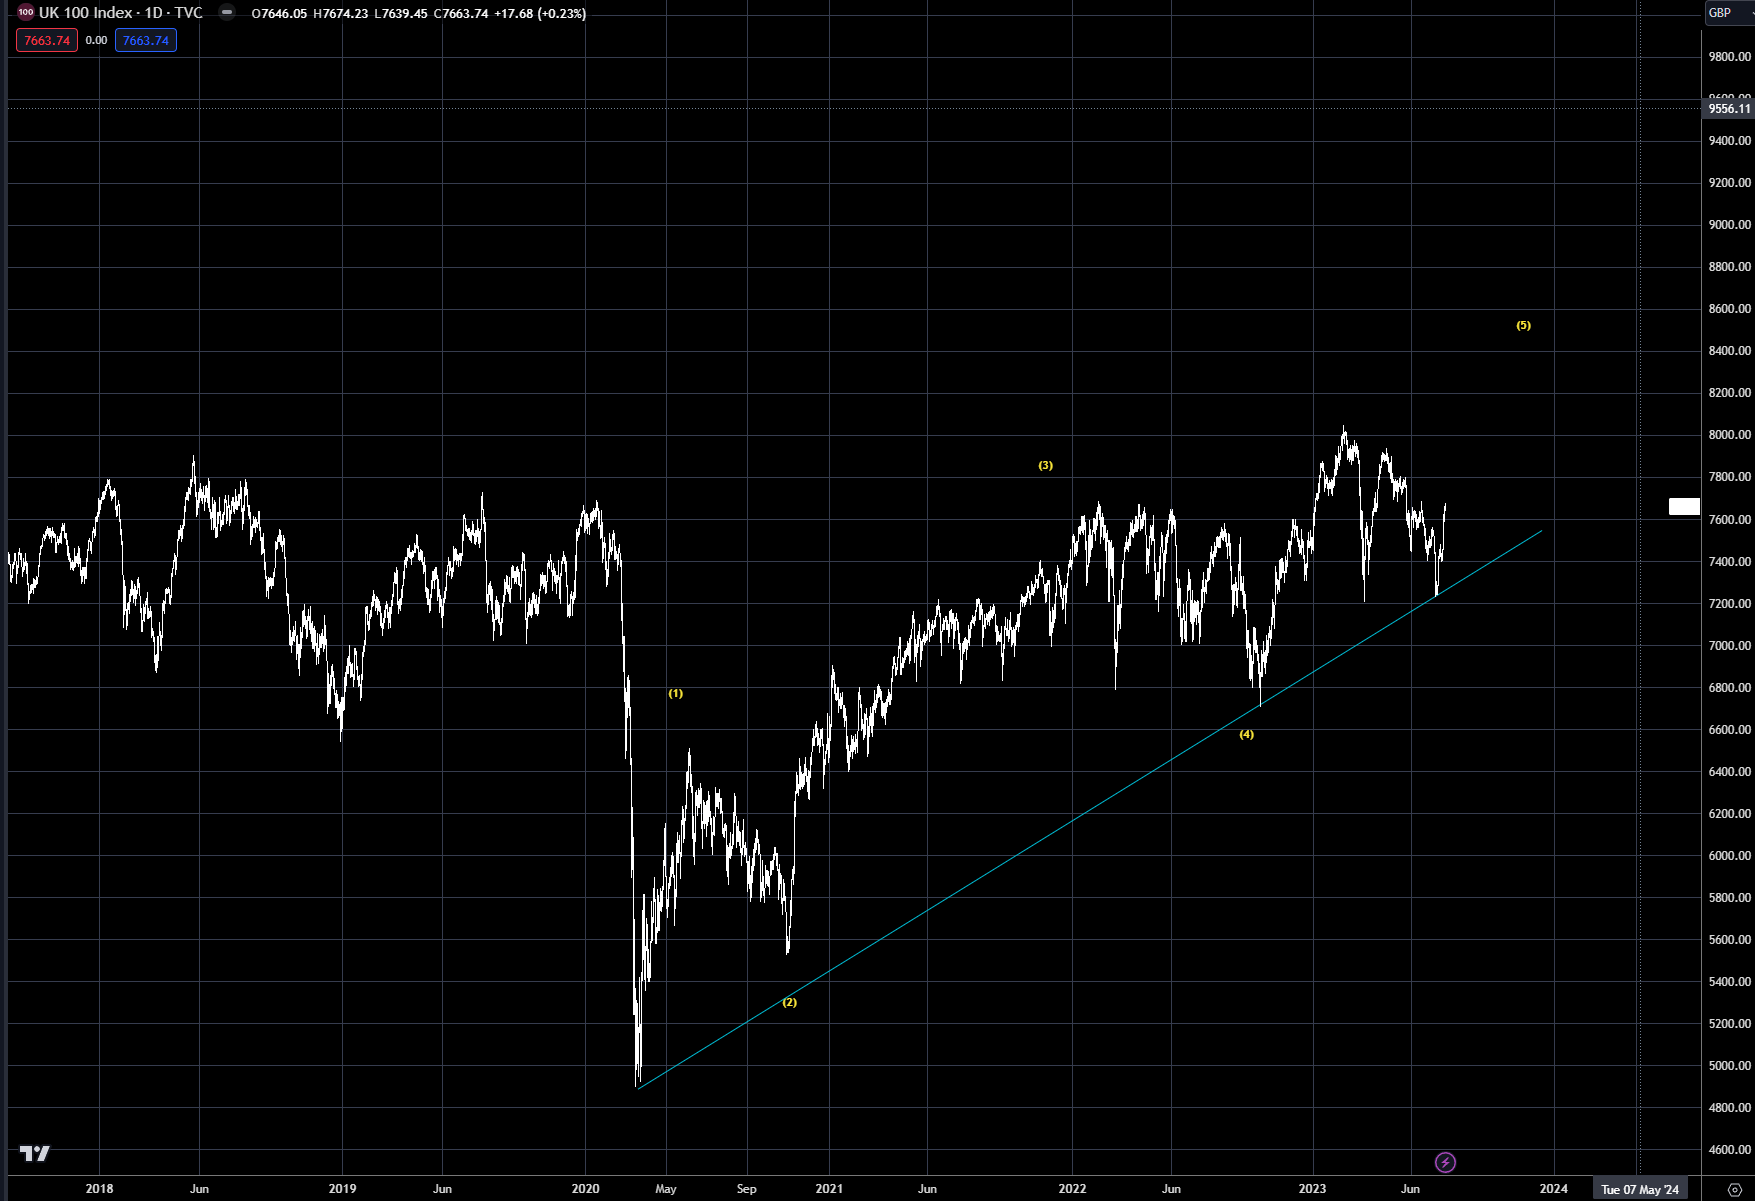
The UK100 also held good support last week near the 7,200 level, the same level as the March 2023 low, forming a launching pad last week as the market rallied up to 7,600+. Another level of support last week that held was the trend line from the 2020 low. The UK market was also driven by positive CPI data last week, coming in below consensus. But the big week for the UK is next week, when the Bank of England meets on Thursday, August 3. The market is looking for a more dovish meeting, after the BOE hiked interest rates by 50 bps in June.
Also, remember that the Federal Reserve meets this week, with their announcement on Wednesday, and the ECB and BOJ meet on Thursday. All will be market drivers for global equities.
UK100
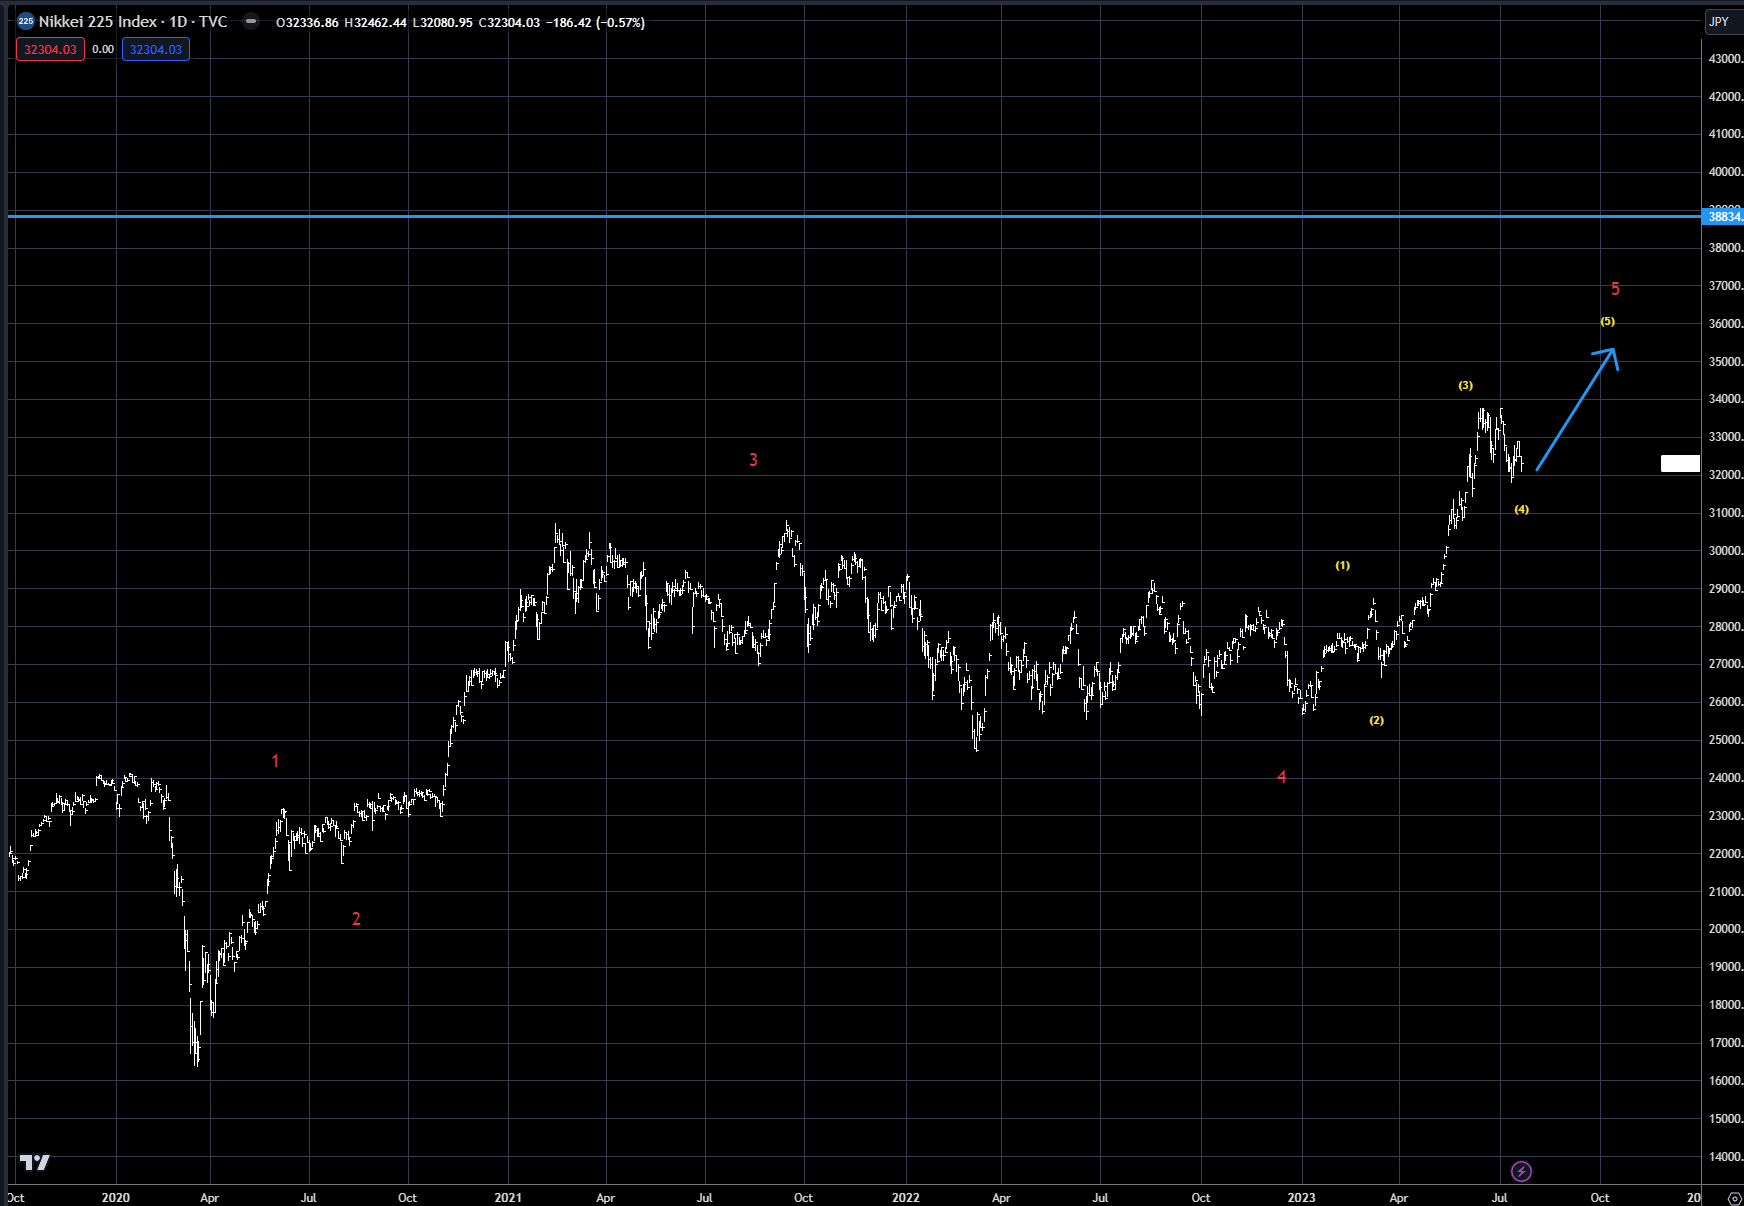
As discussed previously, the Japanese Nikkei is still setting up for a move to test the all-time highs from 1990. Since the 2020 lows, the Nikkei has been tracing out a 5-wave sequence as indicated on the chart below in RED. Wave 5 is broken down into its own sequence, shown in yellow. We are approaching the final wave 5, which typically can be very risky to trade, as they do sometimes fail. Liquidity can be very low in final wave 5 failures, resulting in mini crash-type price action. My point here: final wave 5 should be short-term trading markets, not long-term investing markets.
Japanese Nikkei
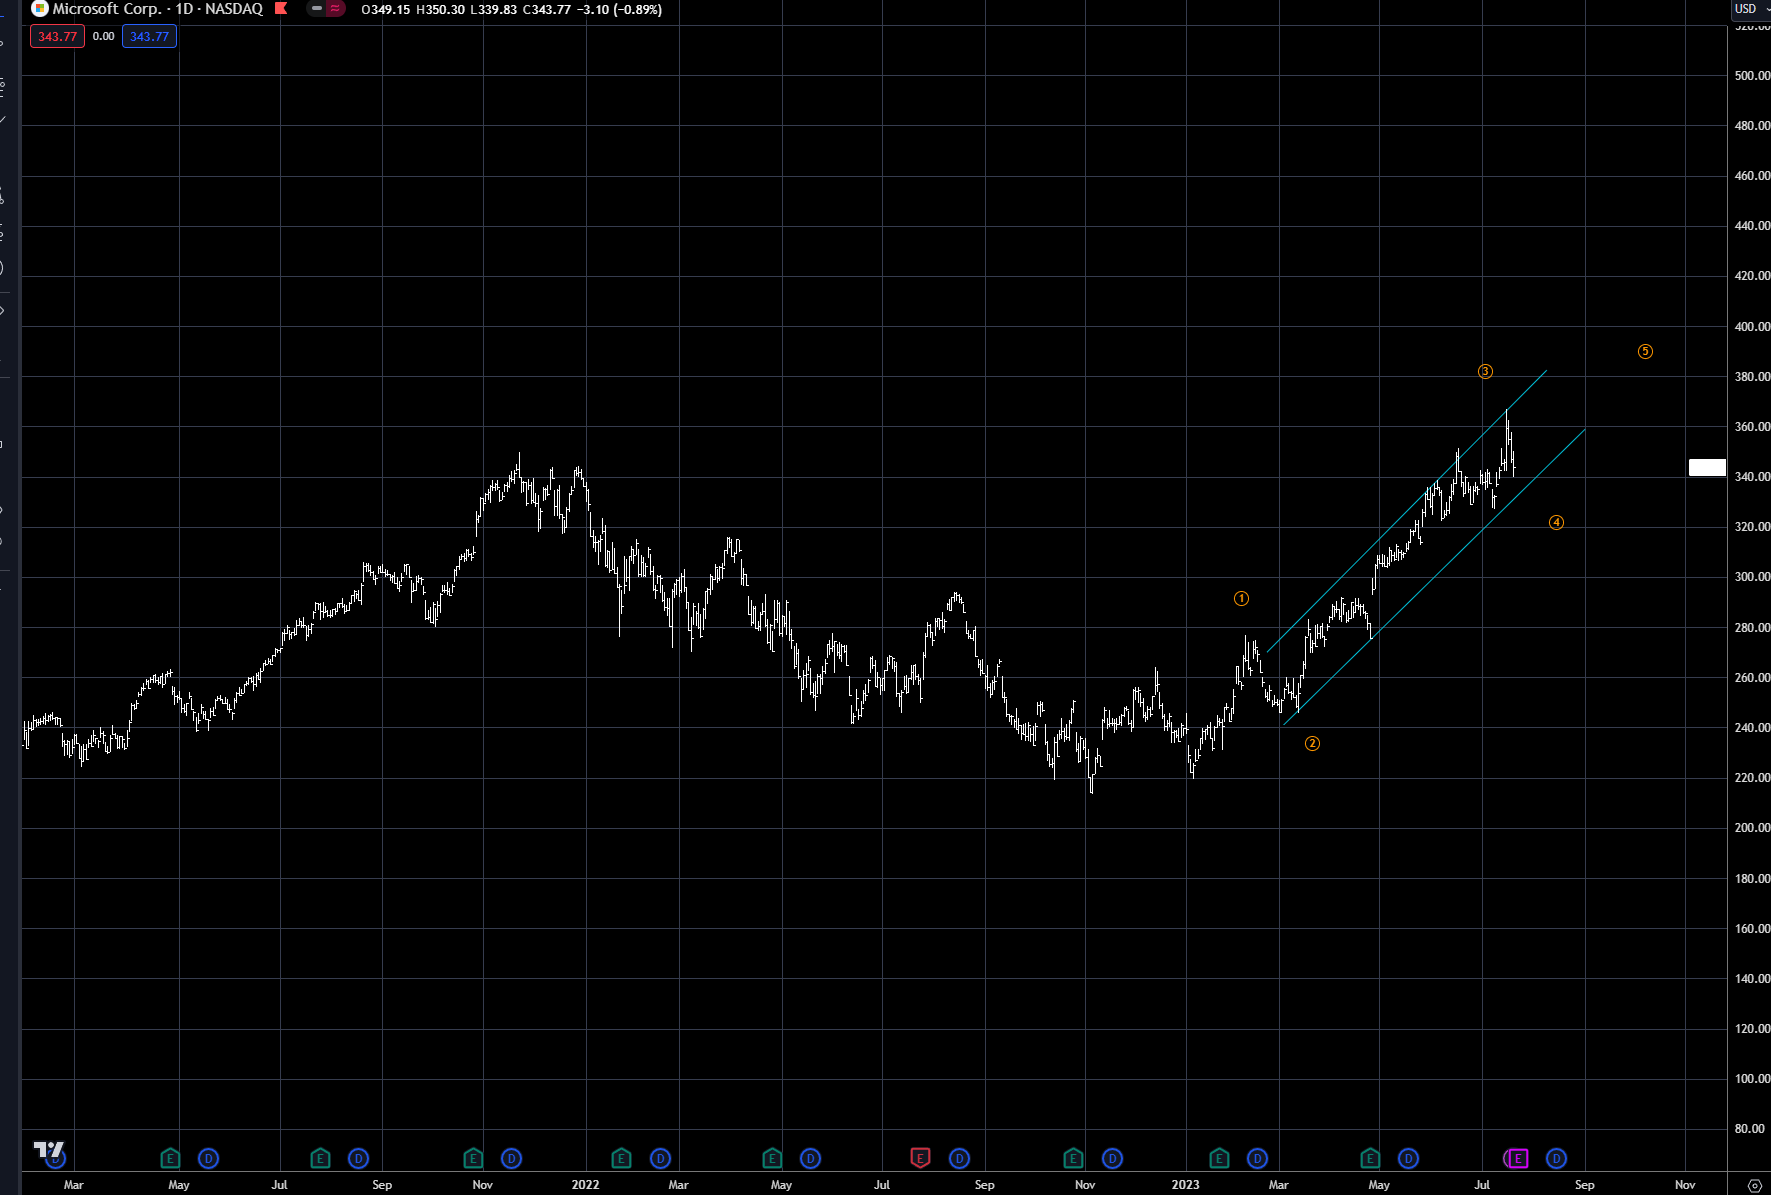
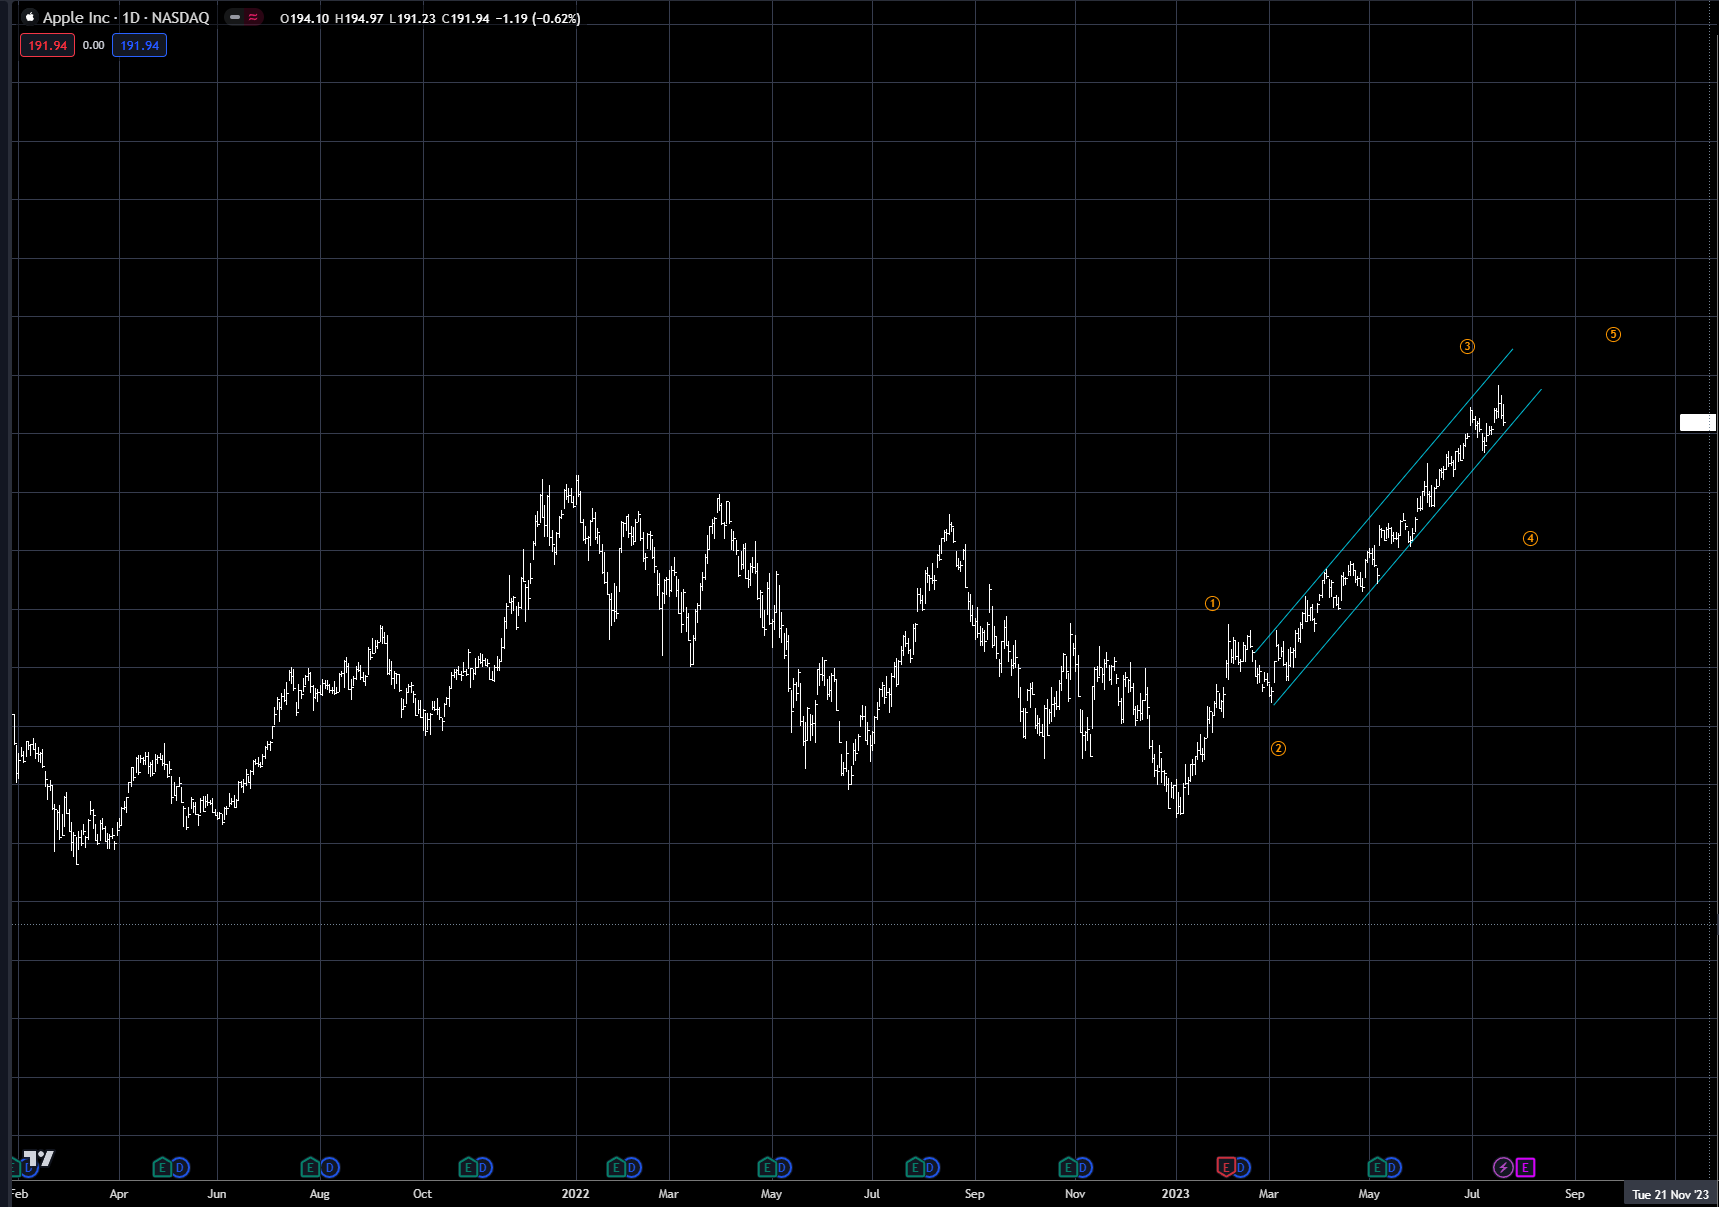
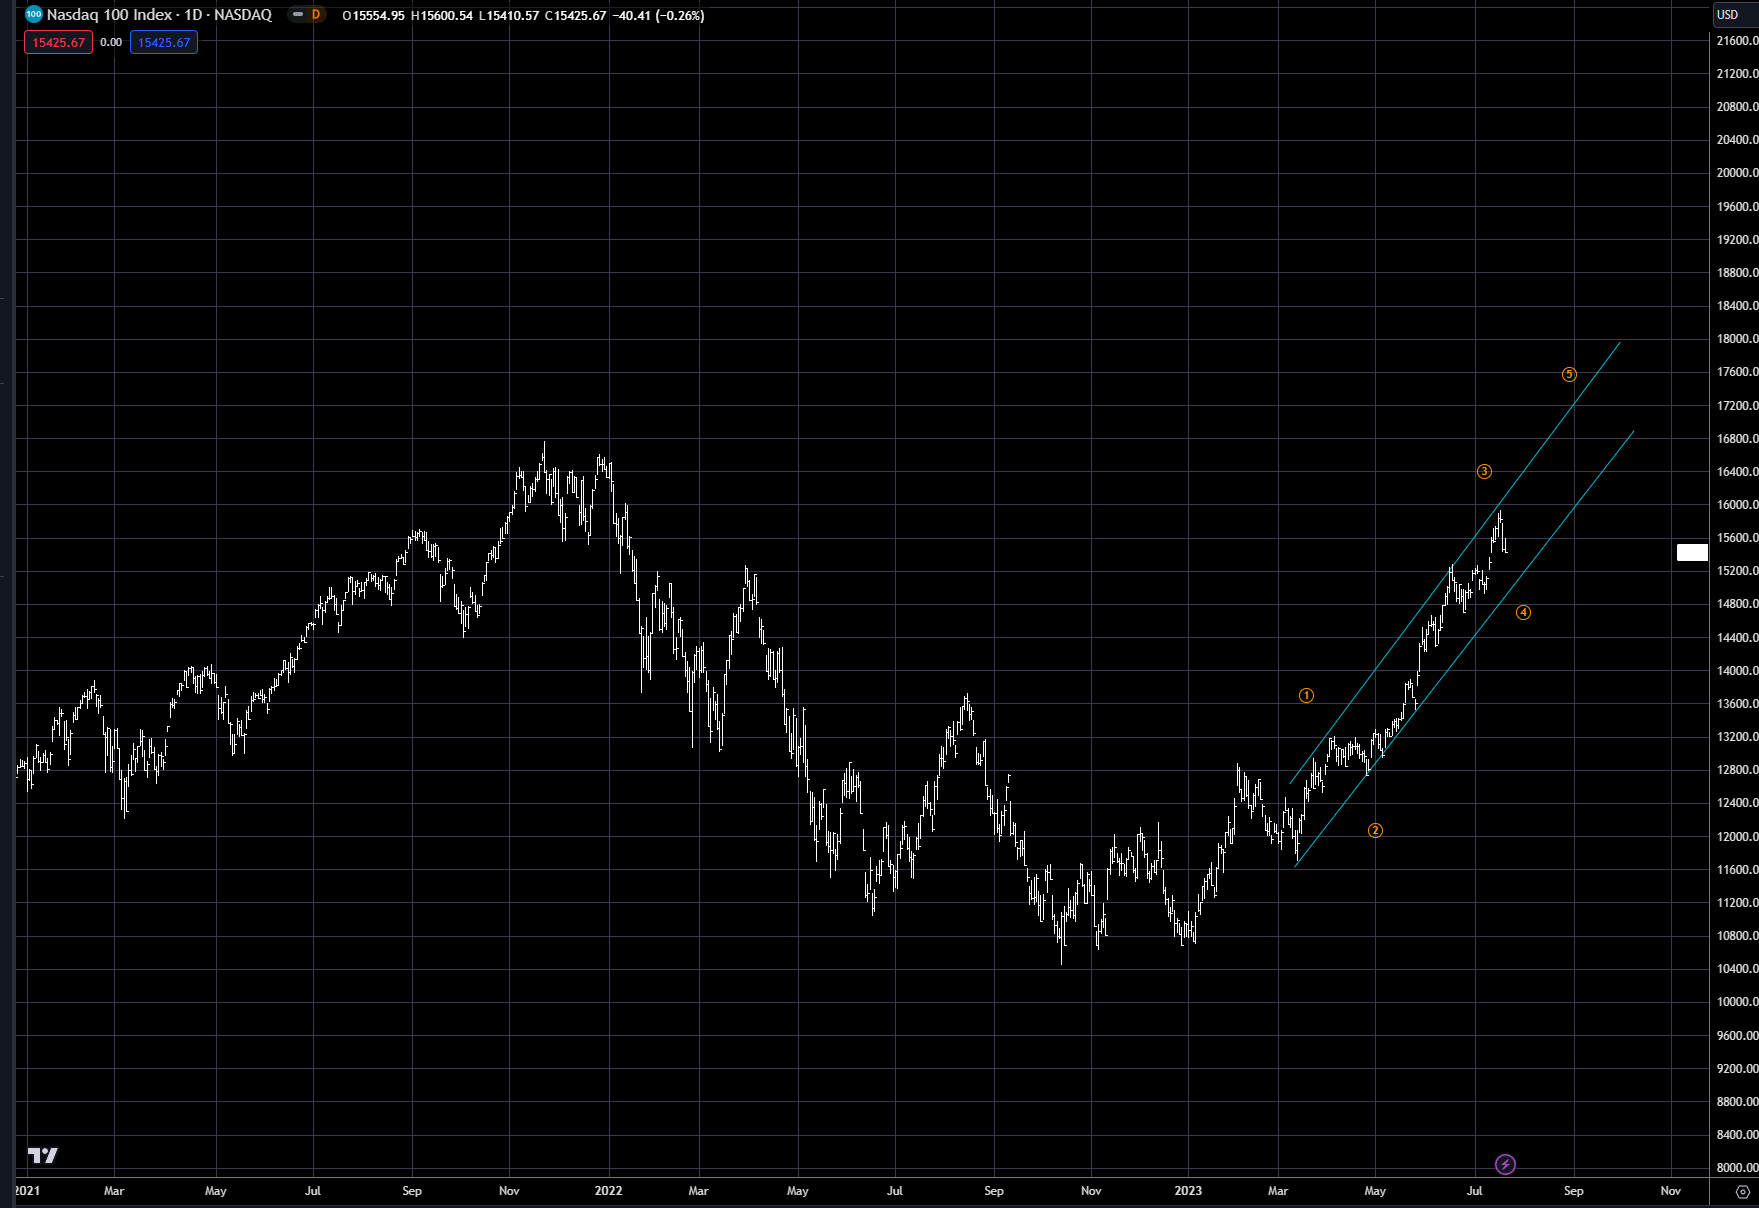
In the US markets, I wanted to focus on the channeling price action that is very prevalent in a few market leaders. For more research on Channels, see the Pattern Site, where Thomas Bulkowski goes into great detail on how to trade in channel markets.
Microsoft, Apple and Meta Platforms (Facebook), and of course the Nasdaq, have all formed channeling price action, which is normally prevalent in wave 3. As you can see by the wave labeling in all four charts, the end of the wave 3 may have occurred last week. What this means is that at a minimum next week we should see a retest of the lower trend line of the channel, but wave 4 correction could breach the bottom of the channel prior to the final leg higher.
This analysis is lining up with all the European markets and the Nikkei setting up one final blow-off top to finish the bull market from the 2020 lows. The key will be in the next week as a number of central banks will be meeting, setting up both a possible correction and also the final leg up.
Microsoft
Apple
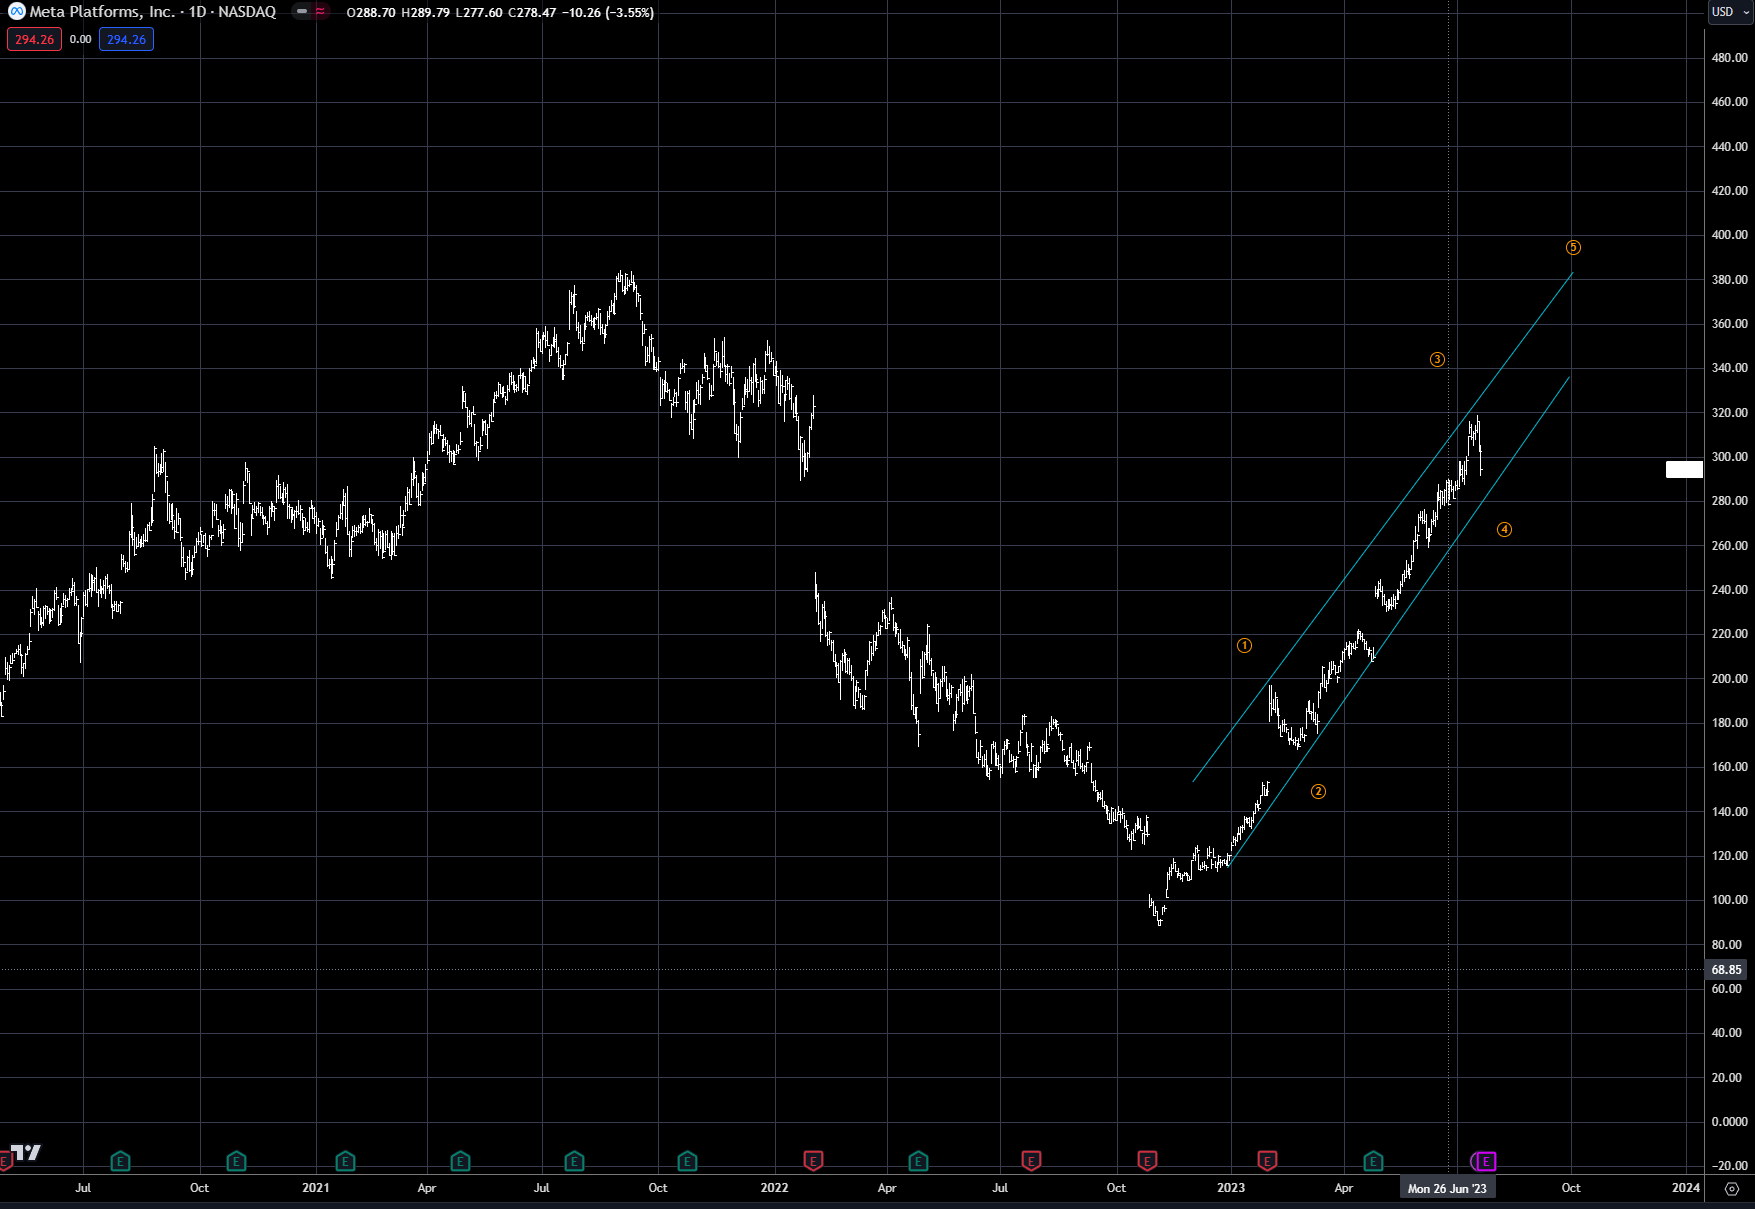
Meta Platforms
Nasdaq 100
Trading strategy is based on the author's views and analysis as of the date of first publication. From time to time the author's views may change due to new information or evolving market conditions. Any major updates to the author's views will be published separately in the author's weekly commentary or a new deep dive.
This content is for educational purposes only and is NOT financial advice. Before acting on any information you must consult with your financial advisor.