This Week in Global Macro (July 31)
Author: Bruce Liegel
Last week, the market saw a plethora of central bank meetings, many regurgitating the same message from the previous meetings, with minimal reaction on the rate front.
For the week, the US 10-year was up 10 bps on the week, the German 10-year was up 2 bps, the UK 10-year was up 6 bps, the Japanese 10-year was up 15 bps (see comments below on the Japan meeting) and China’s 10-year was up 4 bps.
Sometimes, after a big week of market-making events, I like to review the intermediate and long-term prospects for markets that I am actively trading. It usually helps to review where the big trend is and if there were any significant changes that week, and then to look at possible future price action.
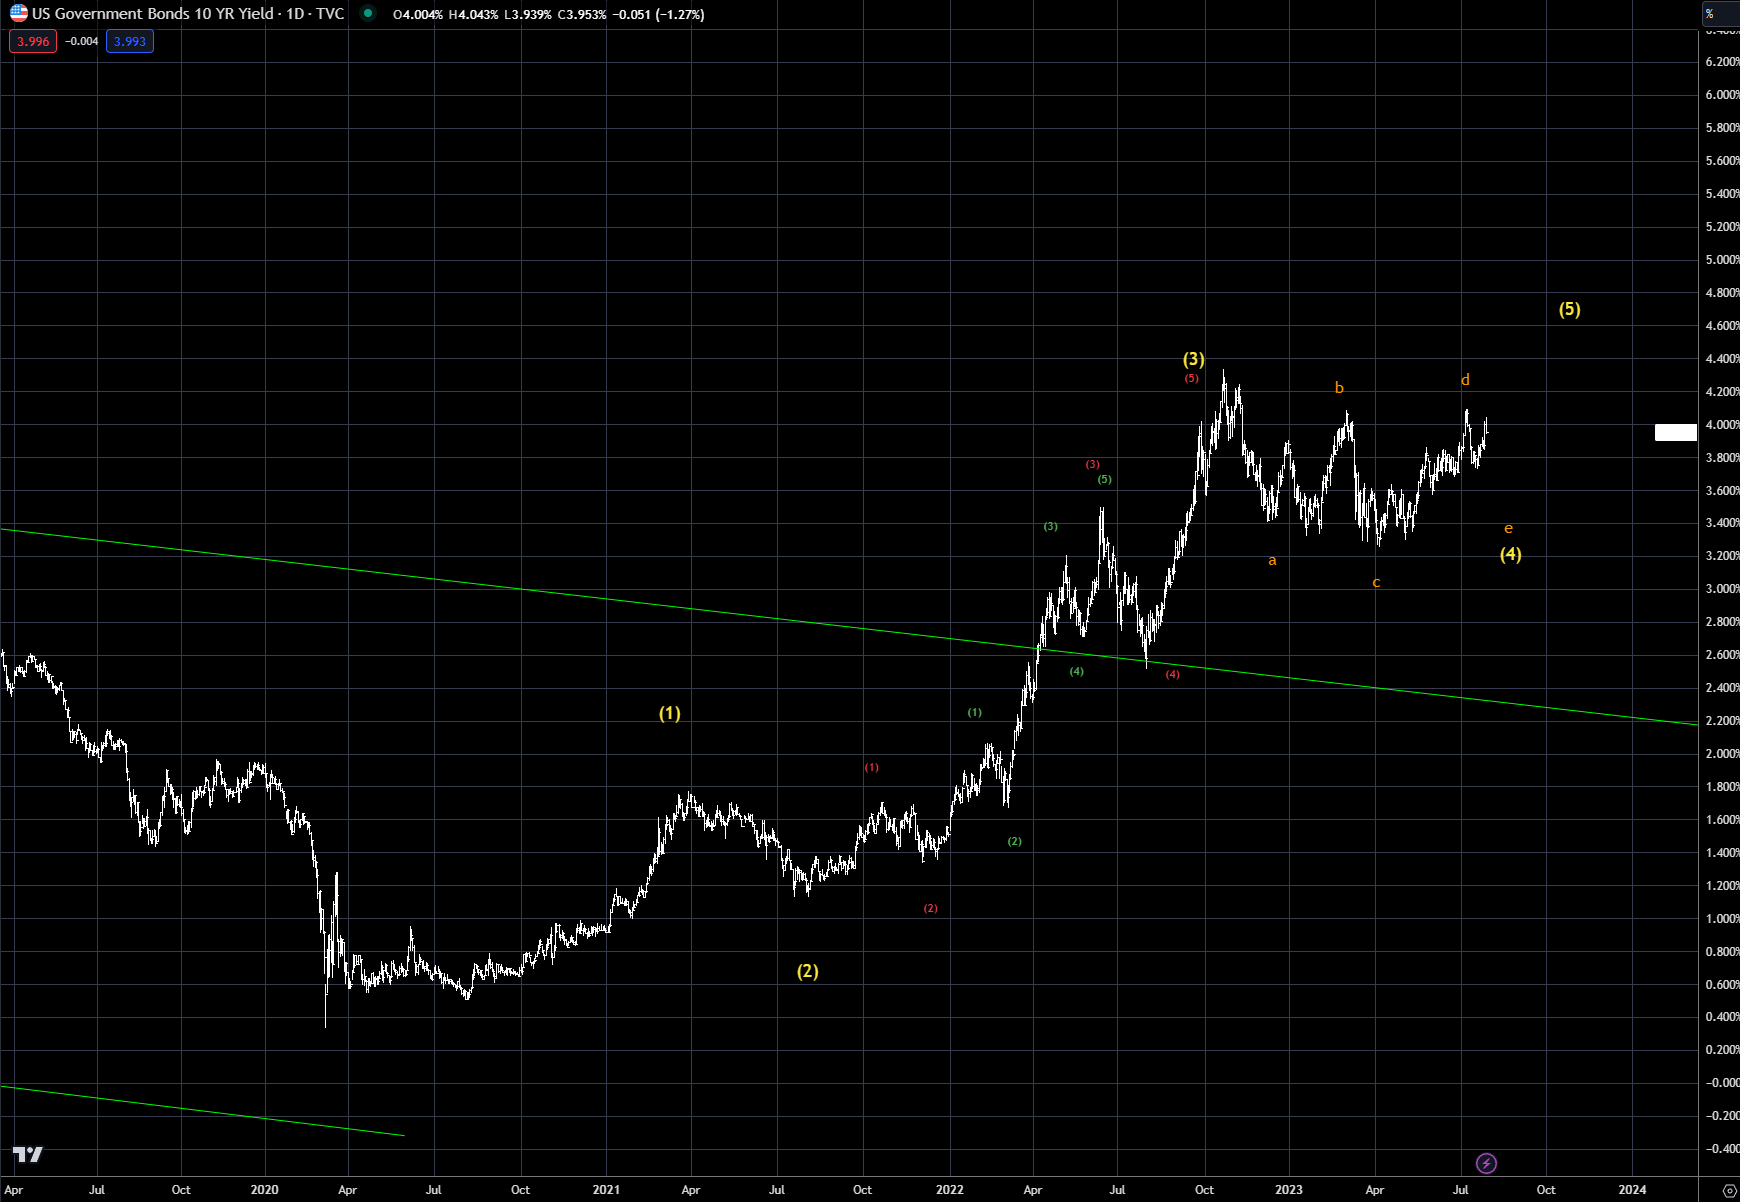
Overall, the US Federal Reserve is keeping the sideways range intact inside a longer-term uptrend, as shown in chart 1. Our base case is still for more upside (higher rates), and nothing changed last week in the market action to signal a potential deviation from that thinking.
Chart 1: US 10-year rates
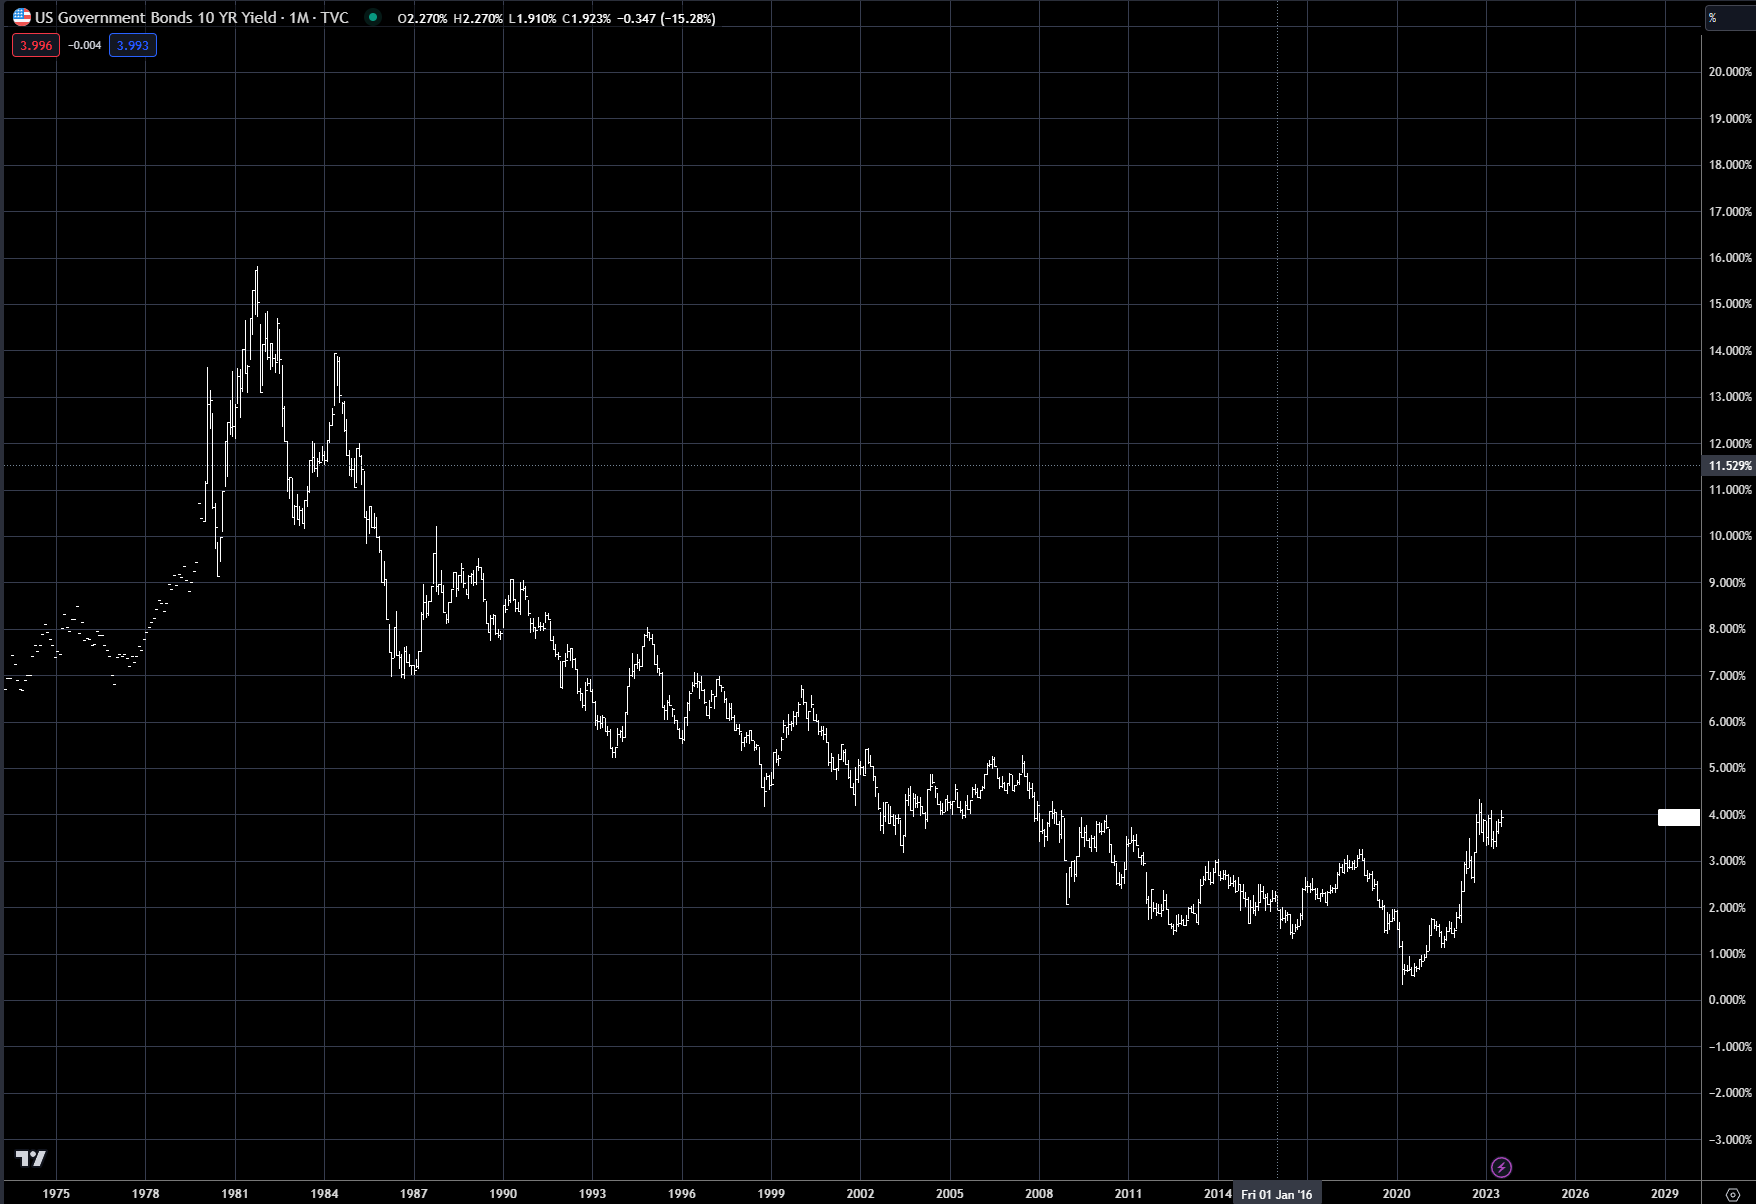
In chart 2, the longer-term view of the US 10-year, as outlined in the deep dive 'The Carry in the Conundrum', is shown. The long-term trend was broken in 2022, signaling the start of a much longer trend change going forward. Remember, the trend is your friend; this doesn’t mean that the market won’t have a sharp correction (lower rates), but the big trade for the next 3-5 years is for higher rates, not lower.
Chart 2: US 10-year rates, long-term chart
With the ECB also meeting last week, it is also good to review the price action in that market.
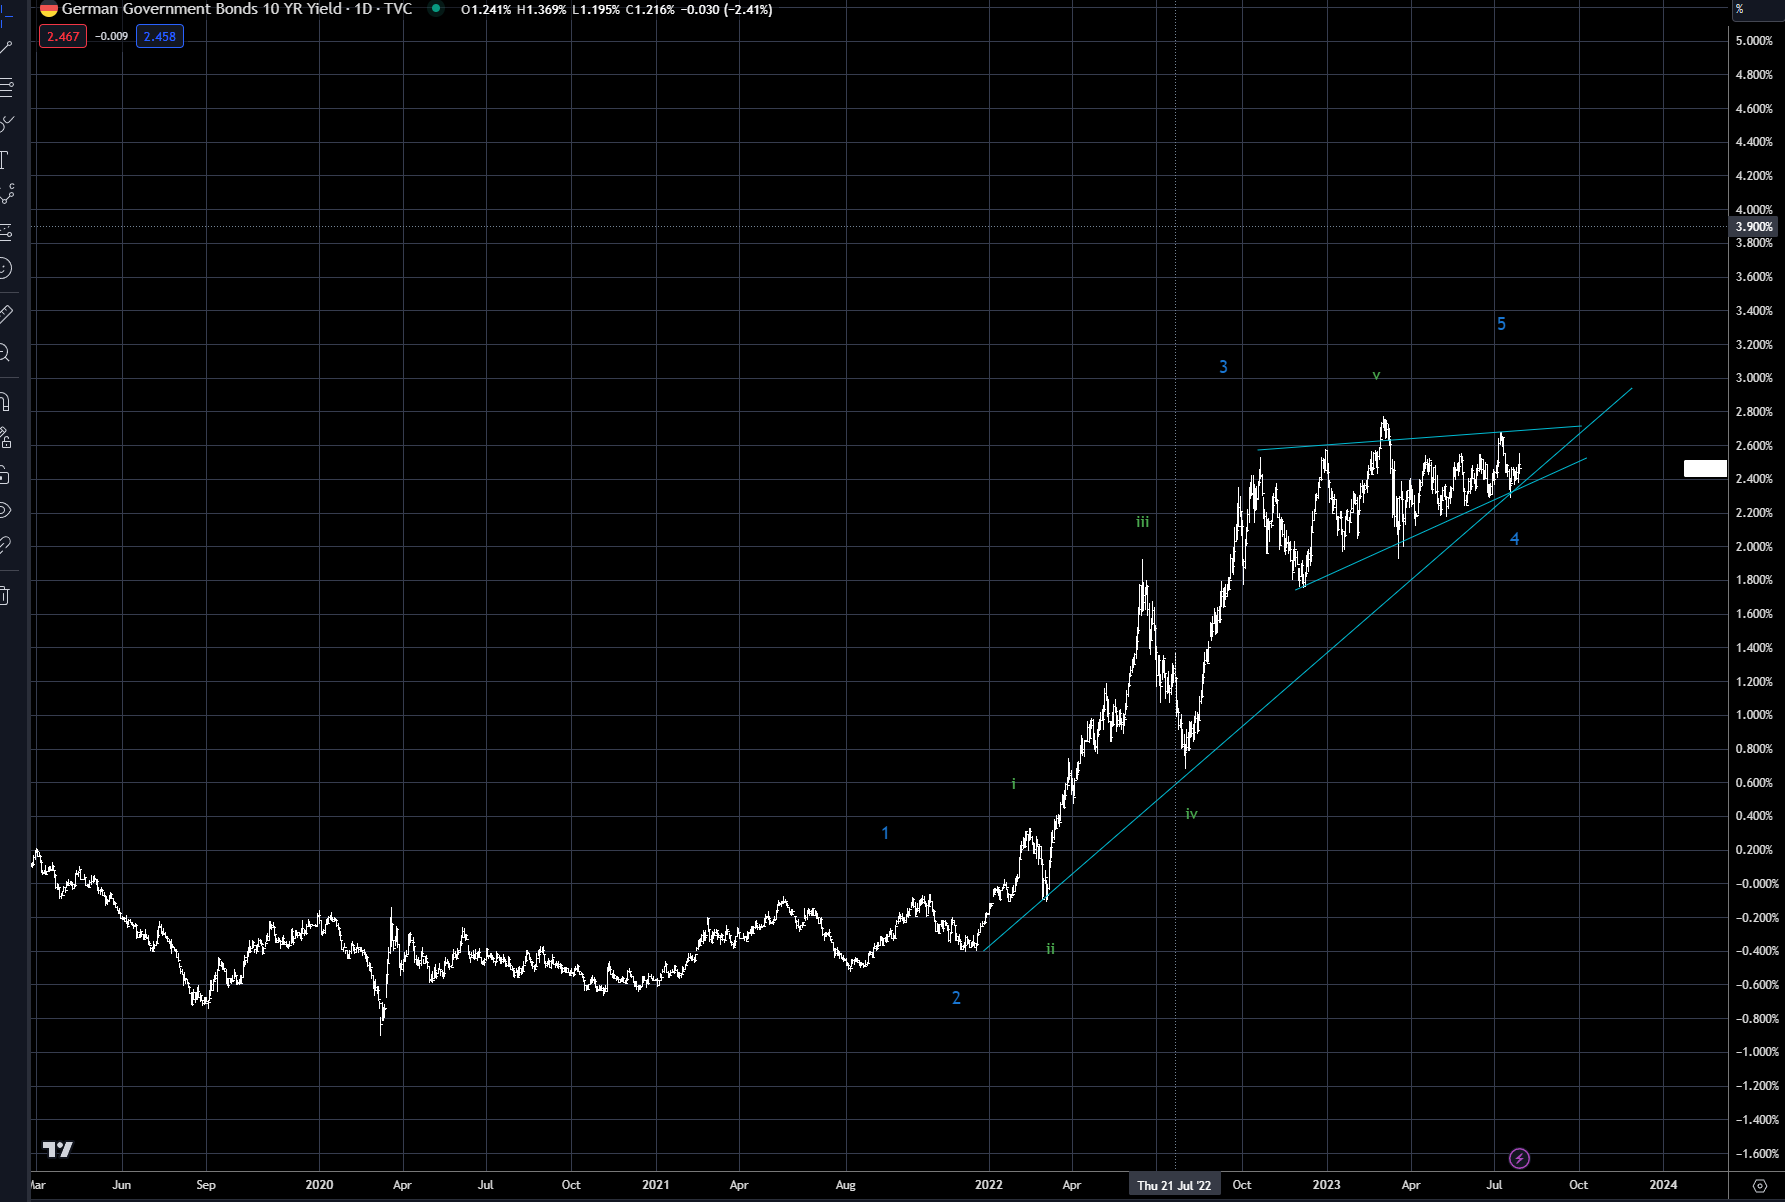
The ECB kept the data dependency mode in play, with the euro initially selling off on the perceived dovish overtures during the press conference. There is a good chance the euro topped out last week, and is set for a pullback to the 1.05-1.06 area. In chart 3 below is the 10-year yield of the German 10-year – the market leader in Europe. The sideways action is consistent with a correction in an upward trend. Note the two significant trendlines converging last week, setting up a springboard for higher rates – the trend is up.
Chart 3: German 10-year
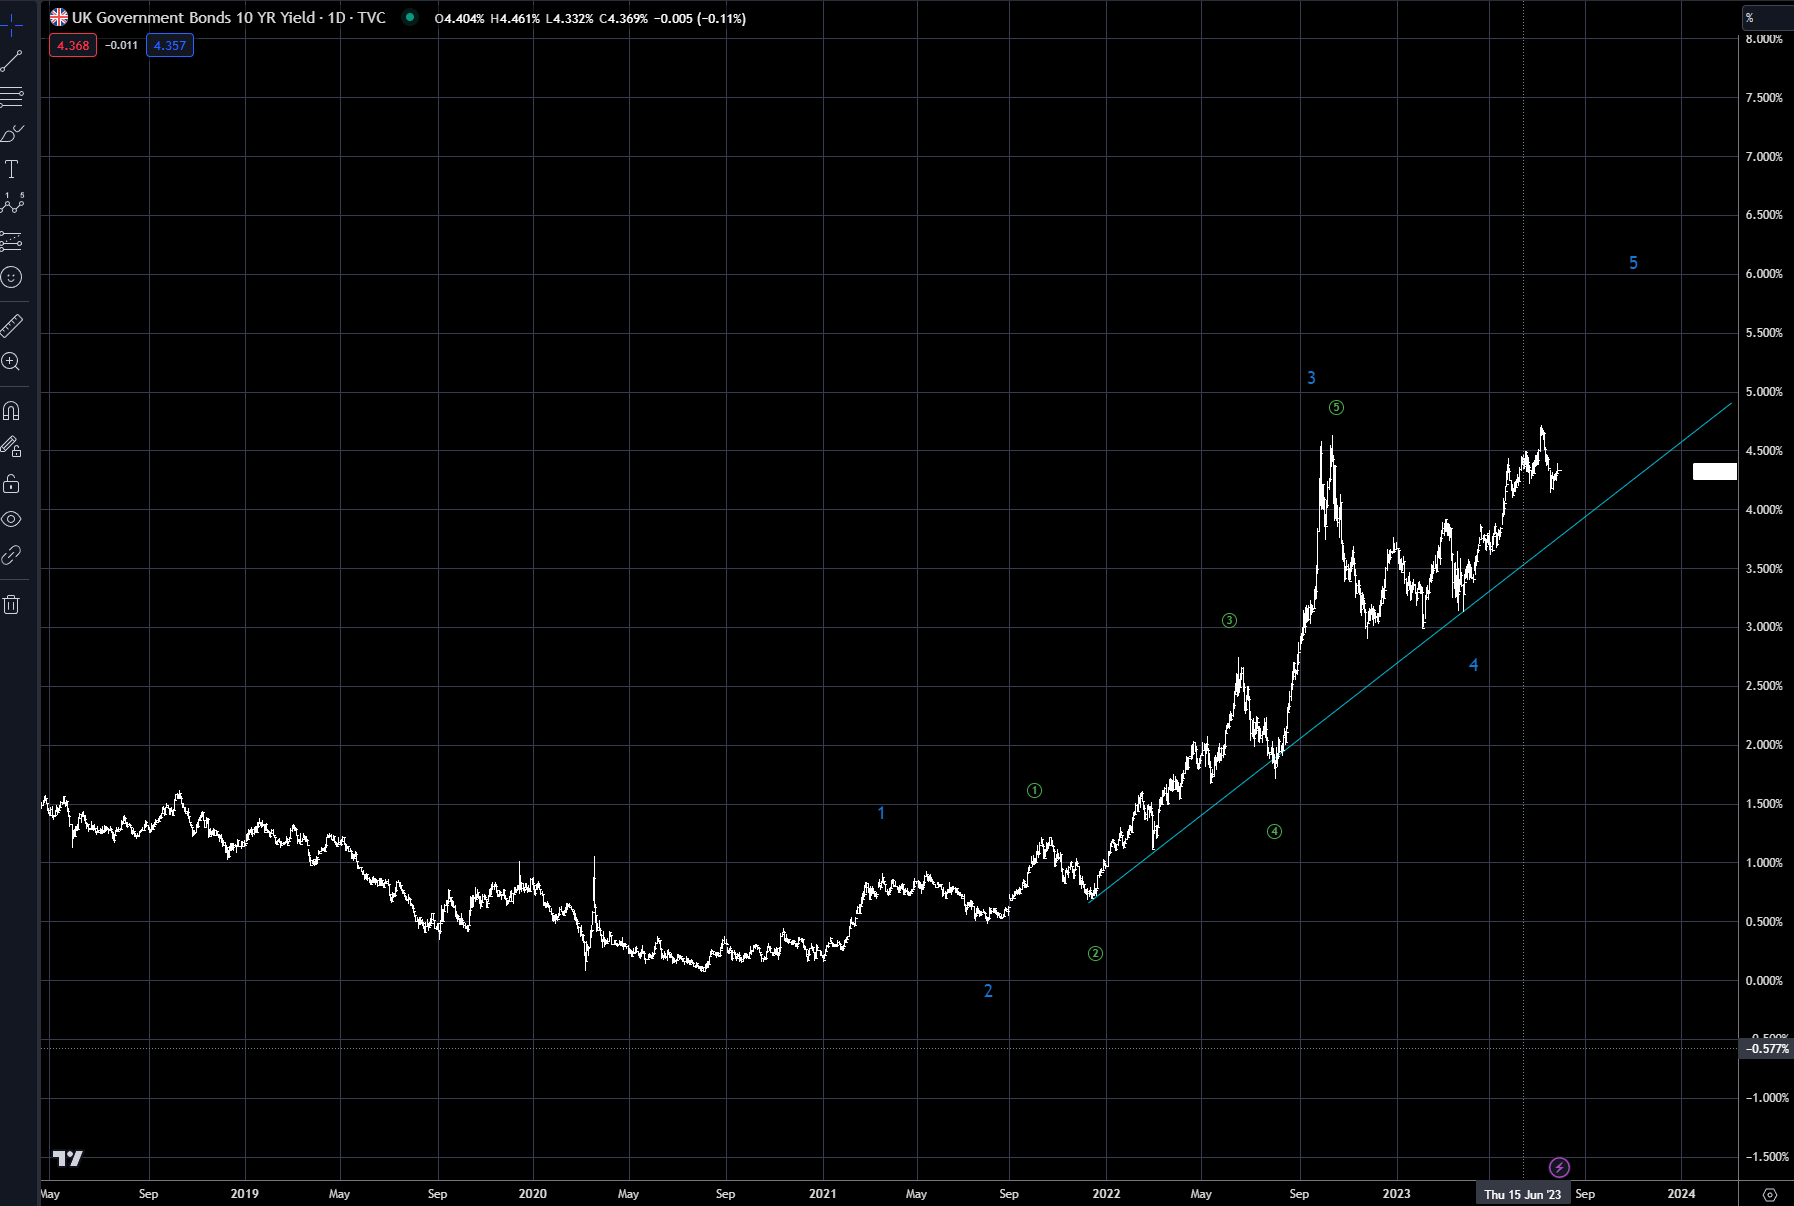
The Bank of England will be meeting this week, with rumors of a potential 50bps hike. The overall trend of the UK 10-year is quite strong, with no correction at all over the previous few weeks, as was the case in the US, and sideways price action in the euro zone. Chart 4 shows the UK 10-year yield – notice the strong trendline in place. The signal that this up trend is over would be a break of trendline, most likely occurring when the BOE changes its monetary policy stance.
Chart 4: UK 10-year
The Bank of Japan, on the other hand, made a slight hint at a change in monetary policy, first by leaking the information to the press, and then symbolically changing the band from 50bps to 100bps on the 10-year JGB.
I think the BOJ was putting its toe in the water to check the temperature of the market – otherwise, why leak the potential policy change to the press 10 hours before the meeting.
The results of the meeting were probably not what they were hoping. While yields did rally, so did the Nikkei, which they are trying to manage down. The yen also was quite a lot weaker, down 1.25% on the day, which is potentially inflationary. Net net, the yen has traded in the same trading range for the last three weeks (1.4250-1.3750), so the BOJ may look at this and watch price action this week. But they clearly do not want a much weaker yen at this stage. Chart 5 shows the price action for the yen.
Chart 5: Japanese yen, weekly chart
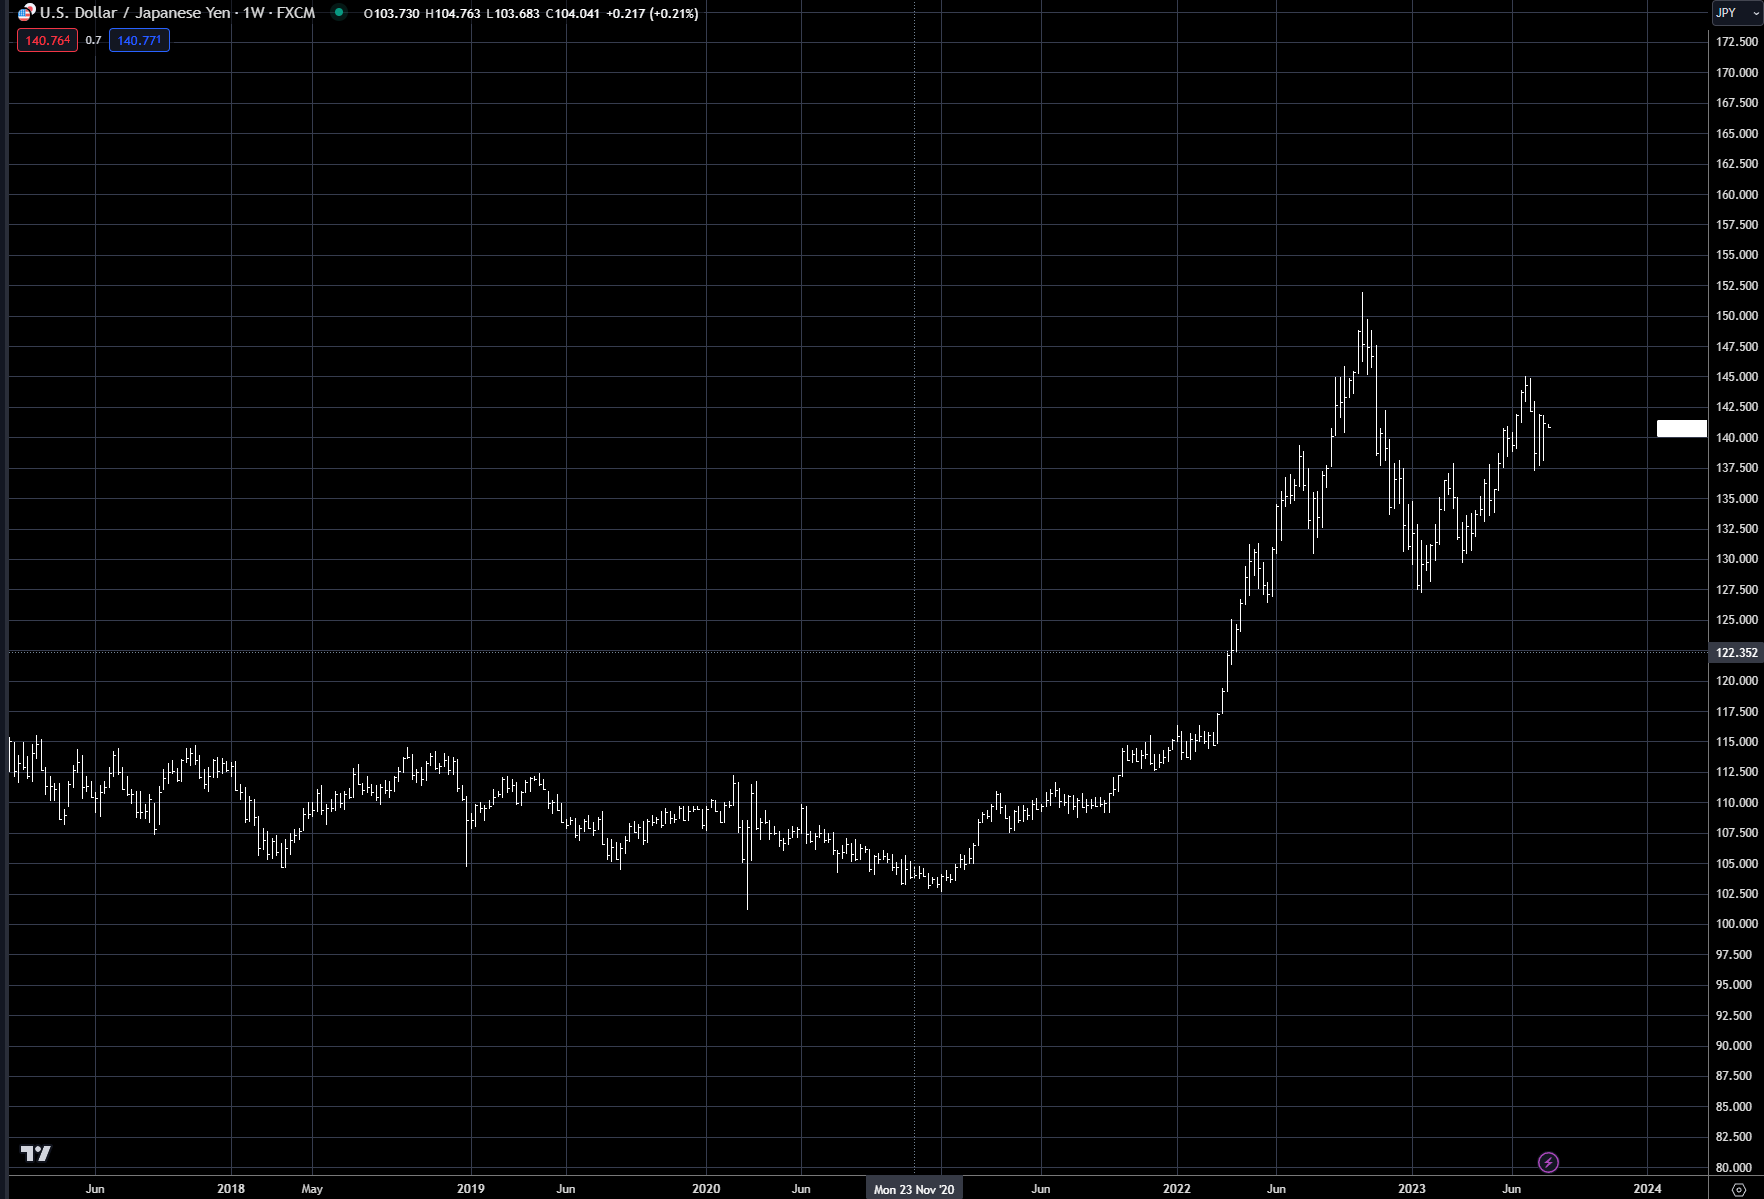
Chart 6 shows the very long-term data for the Japanese 10-year, with the market virtually sideways since early 2000. The circle highlights the high yield for the last 25 years, in or around 2007.
Chart 7 shows the price action of the JGB since this high point in 2007. Notice that (1) the down trend from 2007 has now broken out to the upside, and (2) there is a significant uptrend starting since late 2019. With the upside band now set at 100 bps, look for the market to test the BOJ in the coming weeks.
With the BOJ ending their easing campaign, this has major ramifications for global financial markets. Why? Because the Japanese are such large investors outside their home country.
Chart 6: Japanese 10-year yields, historical chart
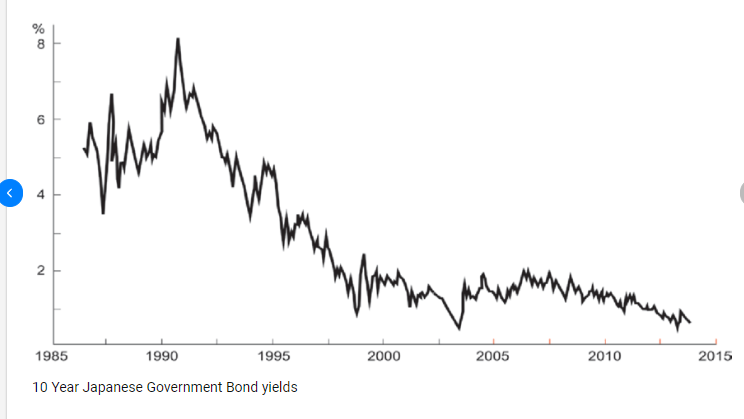
Chart 7: Japanese 10-year yields, current market
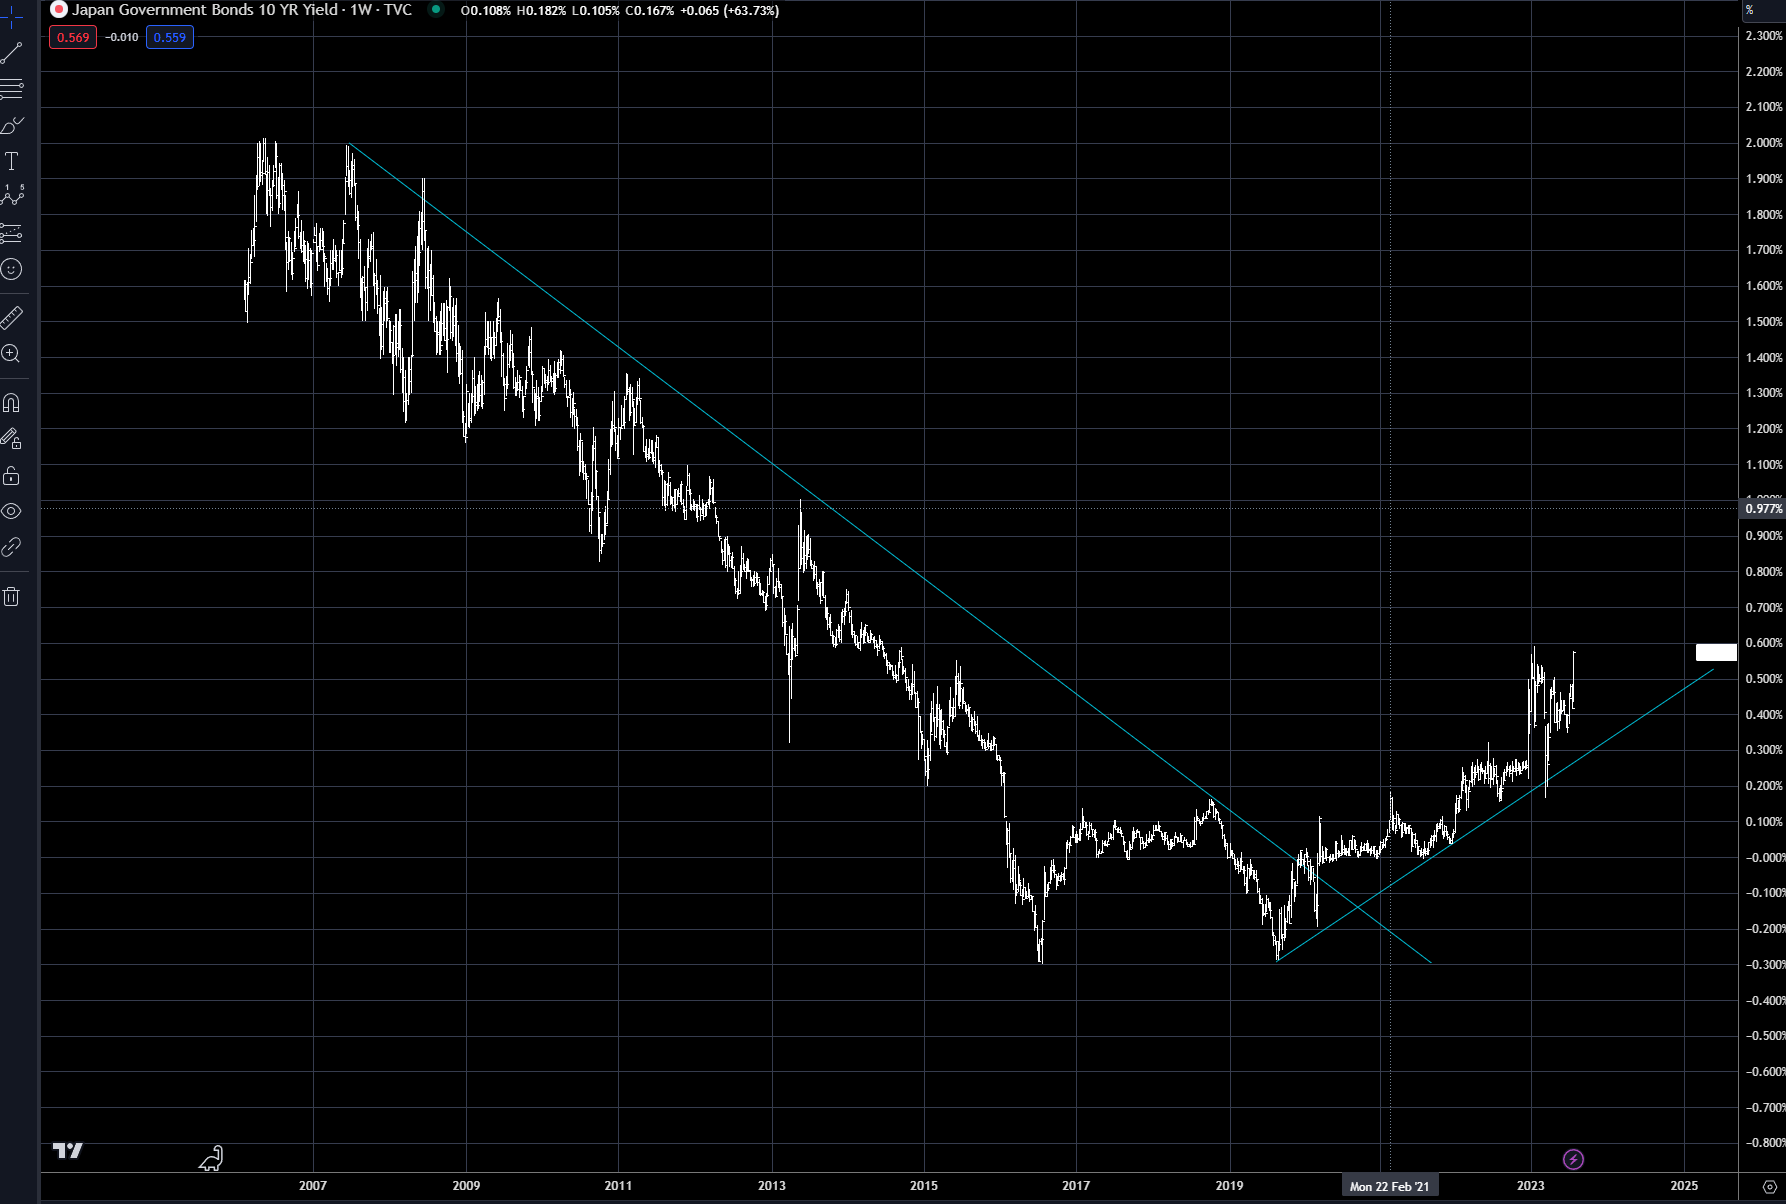
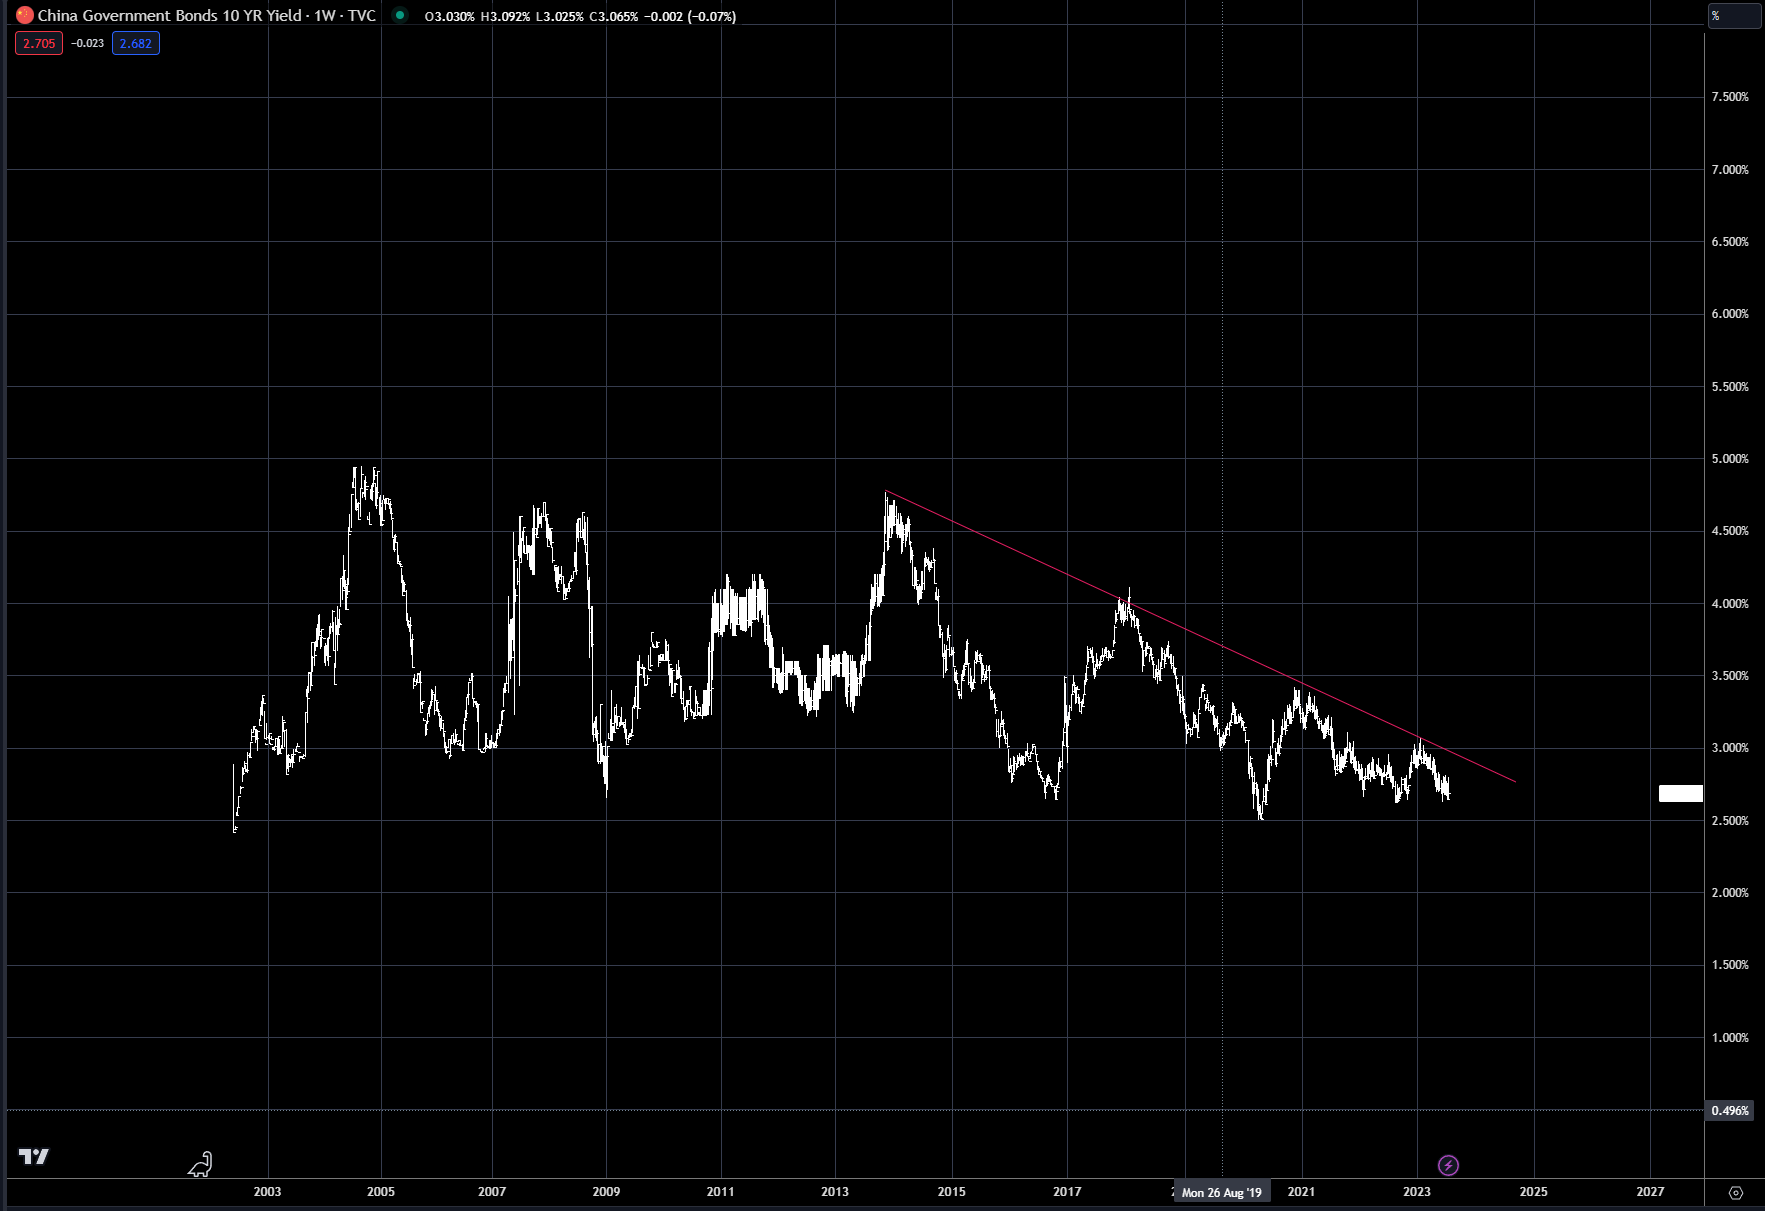
Chart 8: Chinese 10-year rates
Trading strategy is based on the author's views and analysis as of the date of first publication. From time to time the author's views may change due to new information or evolving market conditions. Any major updates to the author's views will be published separately in the author's weekly commentary or a new deep dive.
This content is for educational purposes only and is NOT financial advice. Before acting on any information you must consult with your financial advisor.