Equities Rallied, Rates Jumped, and Spikes in Energy
Author: Bruce Liegel
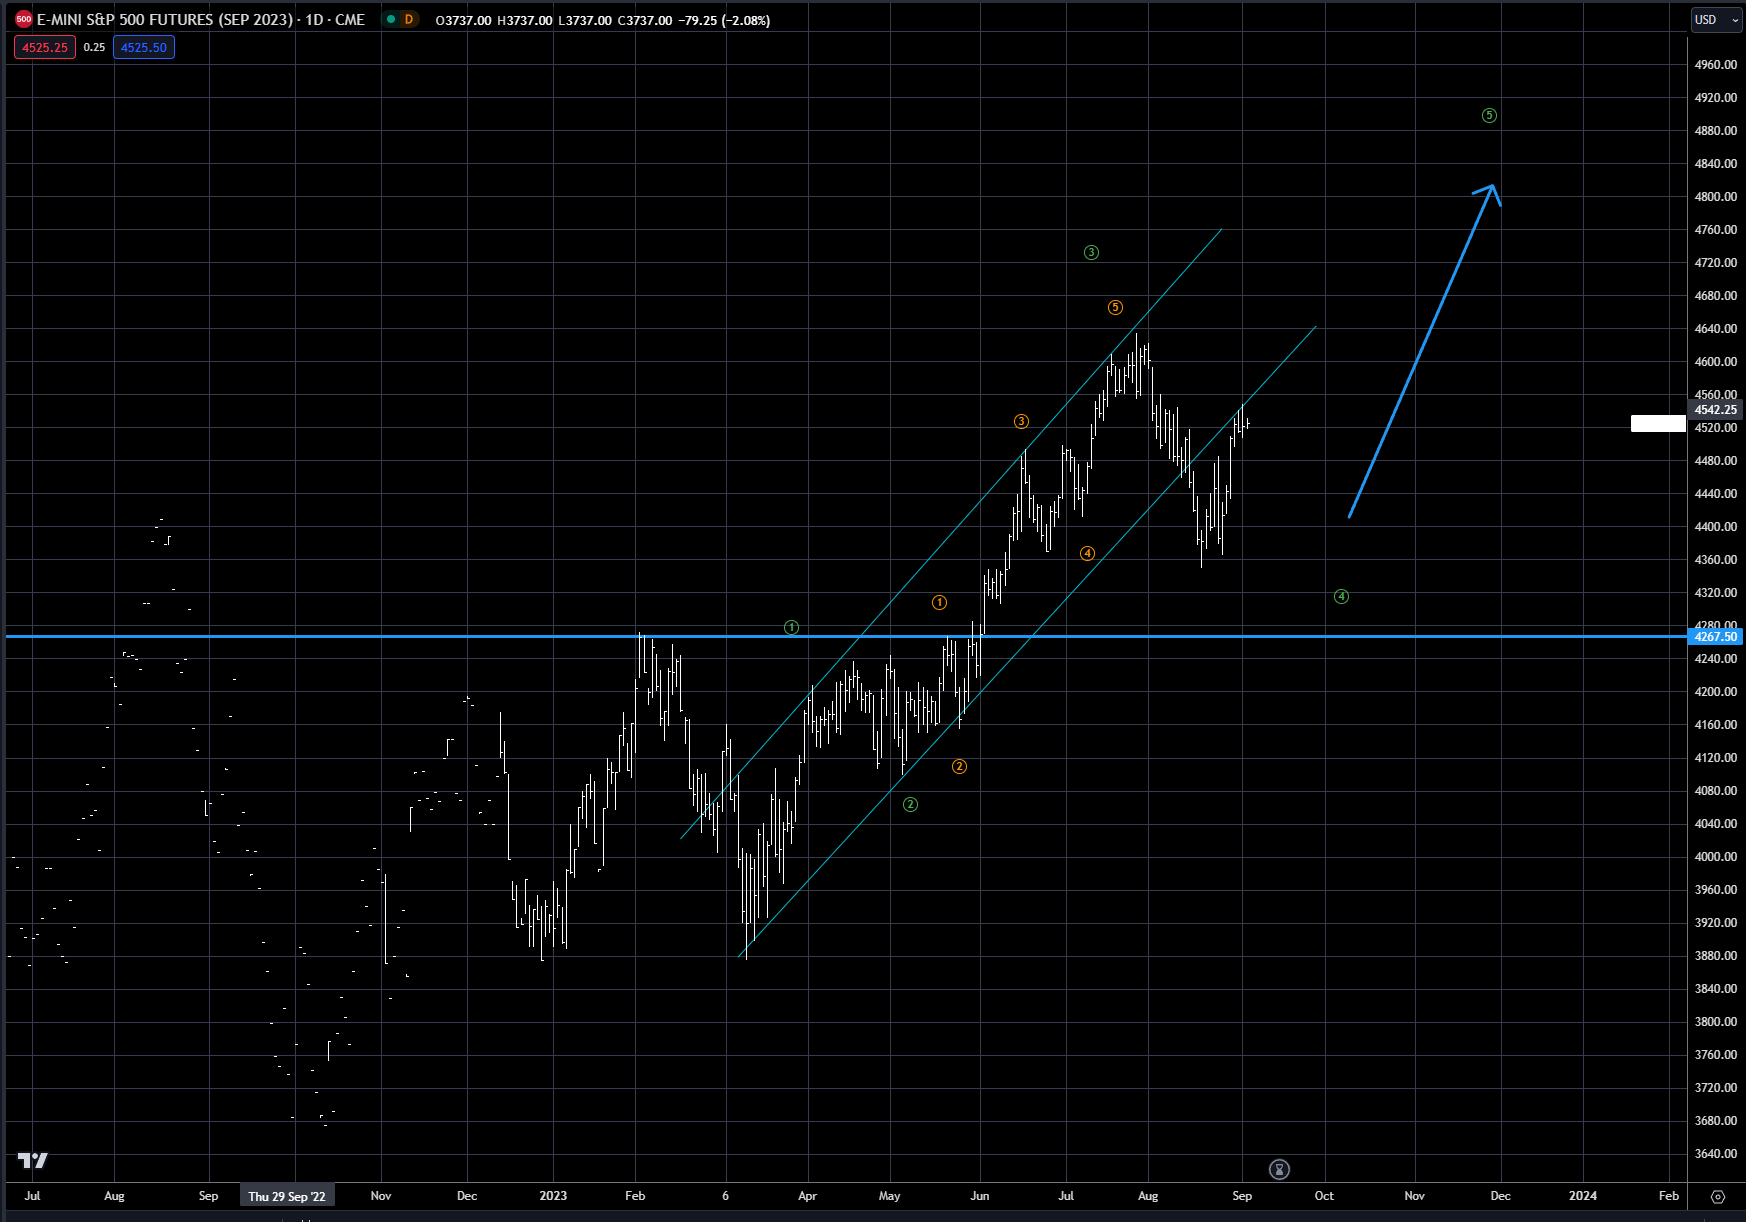
Last week's price action in equities was quite strong, with the corrective rally back to the lower trend line of the channel met with resistance following the mixed non-farm payrolls employment report. As discussed a few weeks ago, the breakout of the trend channel in the S&P 500 (see chart 1) signals a pause in the bull market, but not necessarily the end.
It is quite normal price action for a retest of the broken channel line, as exhibited last week, with a pullback from this area the following week. The ideal path ahead is still for more sideways base building, with the horizontal blue line acting as the big support for the market prior to the market moving higher.
Chart 1: S&P 500 September futures
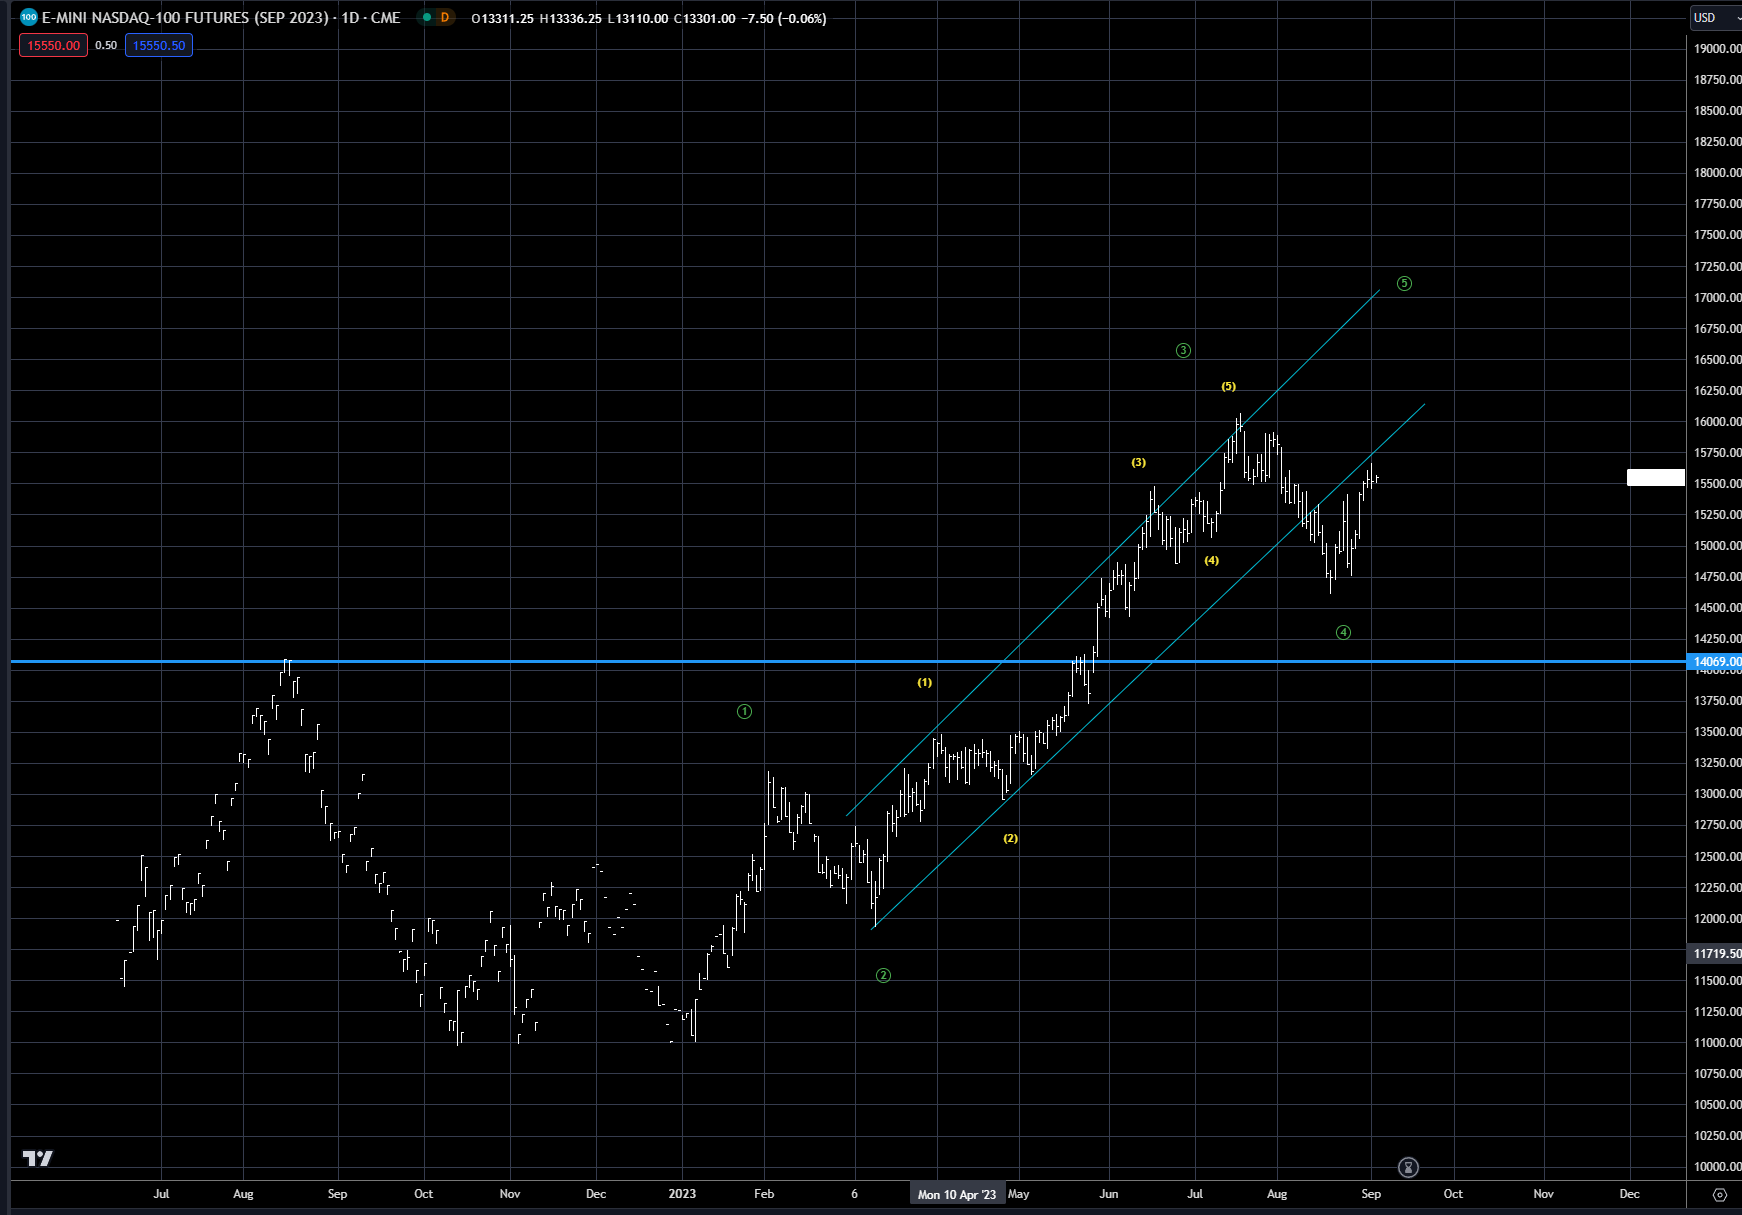
Nasdaq is seeing similar price action as the S&P500 (see chart 2), with the market retesting the channel breakout line and failing on Friday. We should be looking for a 1-2 week correction from this level, with the horizontal blue line the best support.
Chart 2: Nasdaq September futures
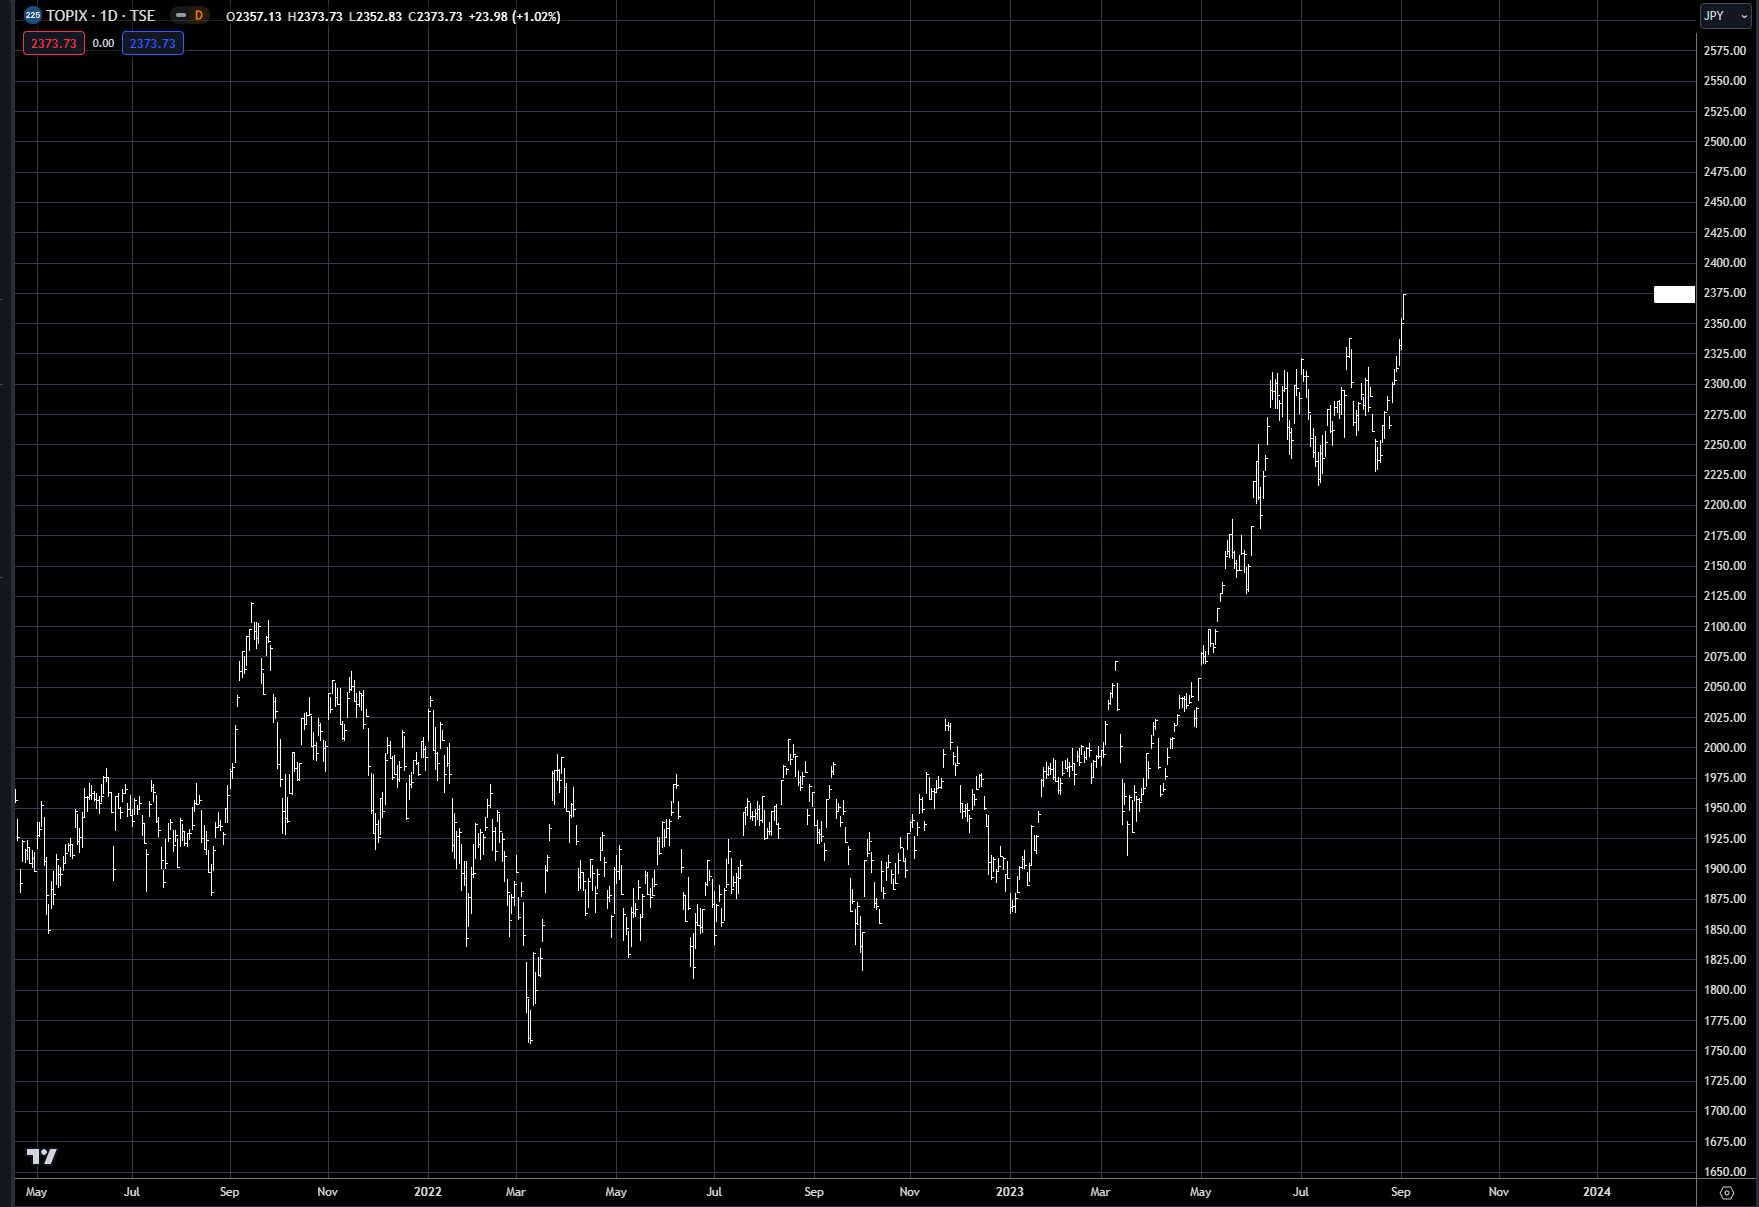
The Japanese Nikkei (see chart 3) continues to be setting up for a test of the all-time high, marked by the horizontal blue line, near the 39,000 level. Any pullbacks over the next week could be looked at as buying opportunities. The Topix is already making new highs for this move (see chart 4), with its targeted all- time highs near the 3,000 level.
The Topix is the overall stock index on the TSE, encompassing all of the first-section stocks, while the Nikkei comprises just the first 225. This article explains what the Topix market is, if you’re looking for more information.
Chart 3: Japanese Nikkei 225 index
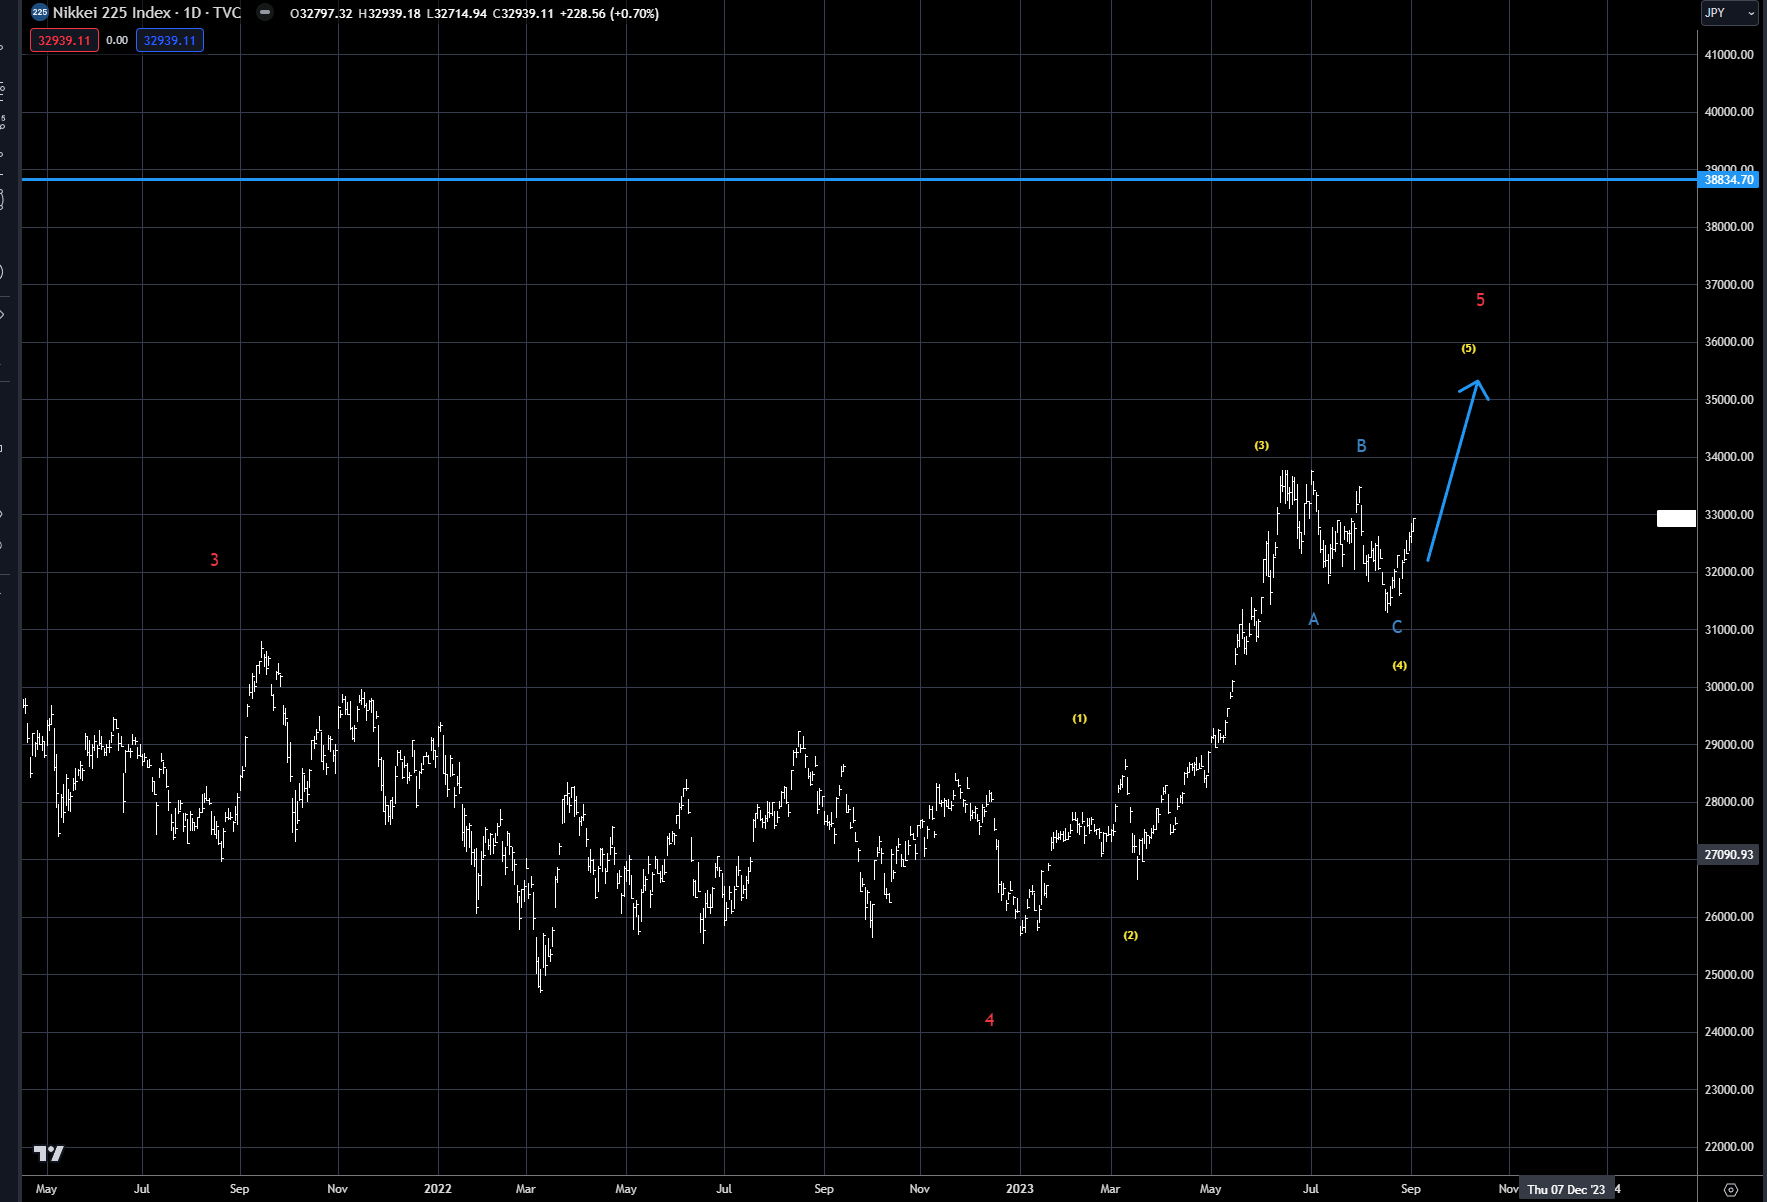
Chart 4: Japanese Topix
Global interest rates jumped on Friday after the NFP employment report, with Cleveland Fed member Loretta Mester signaling rates need to move higher. This reversed the price action sharply, with the 10-year trading below 4.10% before her comments and closing near 4.20% after the hawkish tone. The upside is still open, with the target level for the 10-year of 4.5-4.75% still in play. See chart 5 for the US 10-year.
German 10-year rates (see chart 6) continue to grind upwards, with the objective still over 3% in this move. Last week's lows once again held the upward tend line from the beginning-of-the-year lows.
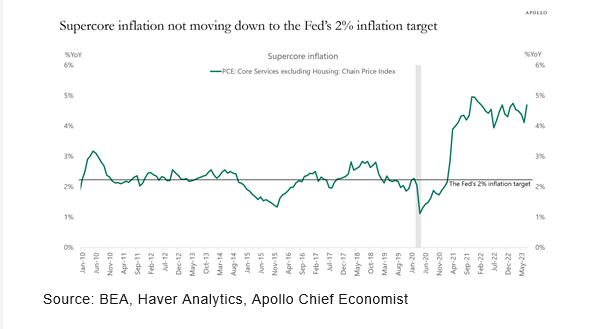
There is no sign that global central banks are ready to switch policy stances yet as inflation, especially 'supercore' inflation, continues to be quite sticky (see chart 7). European inflation rates are also running well north of their target levels. Energy prices, as pointed out last week, also continue to move higher.
All signs continue to point to tight monetary policies in the US and Europe.
Chart 5: US 10-year
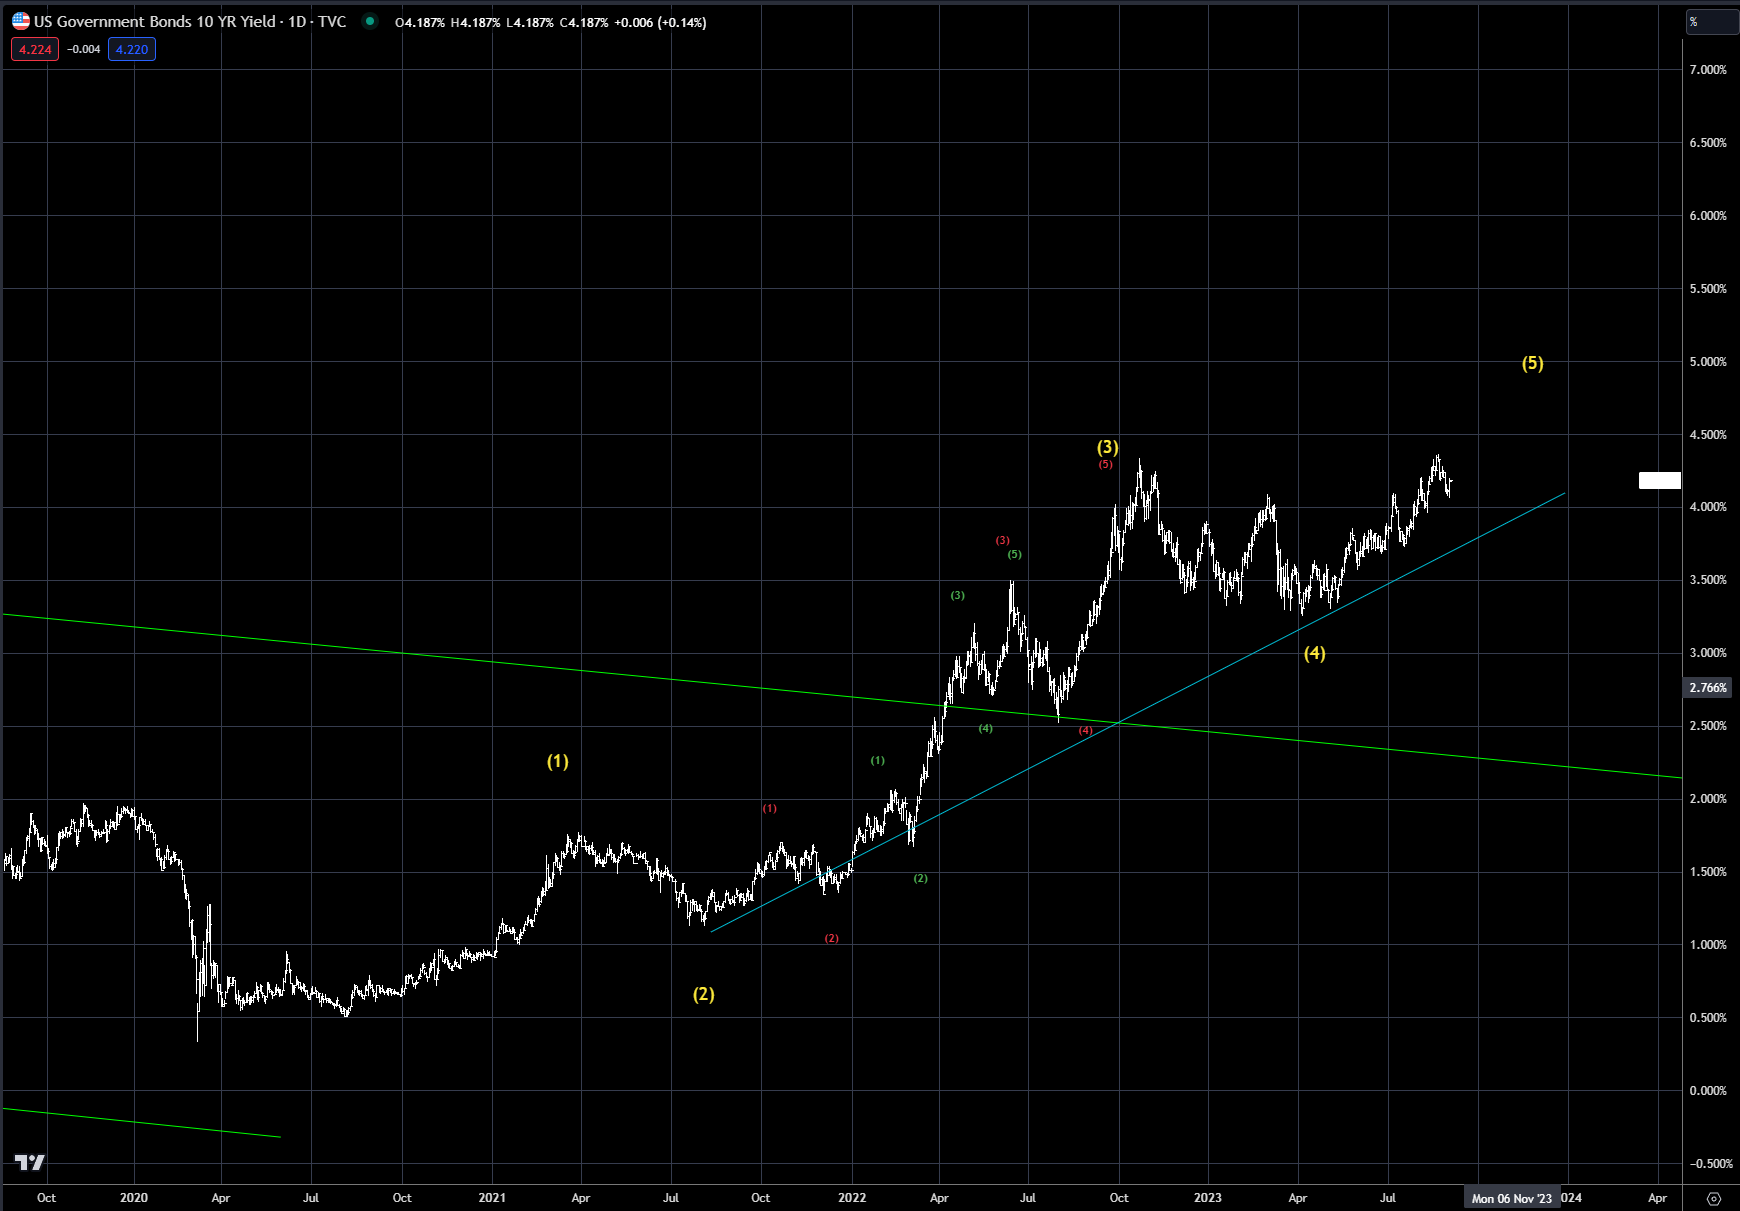
Chart 6: German 10-year
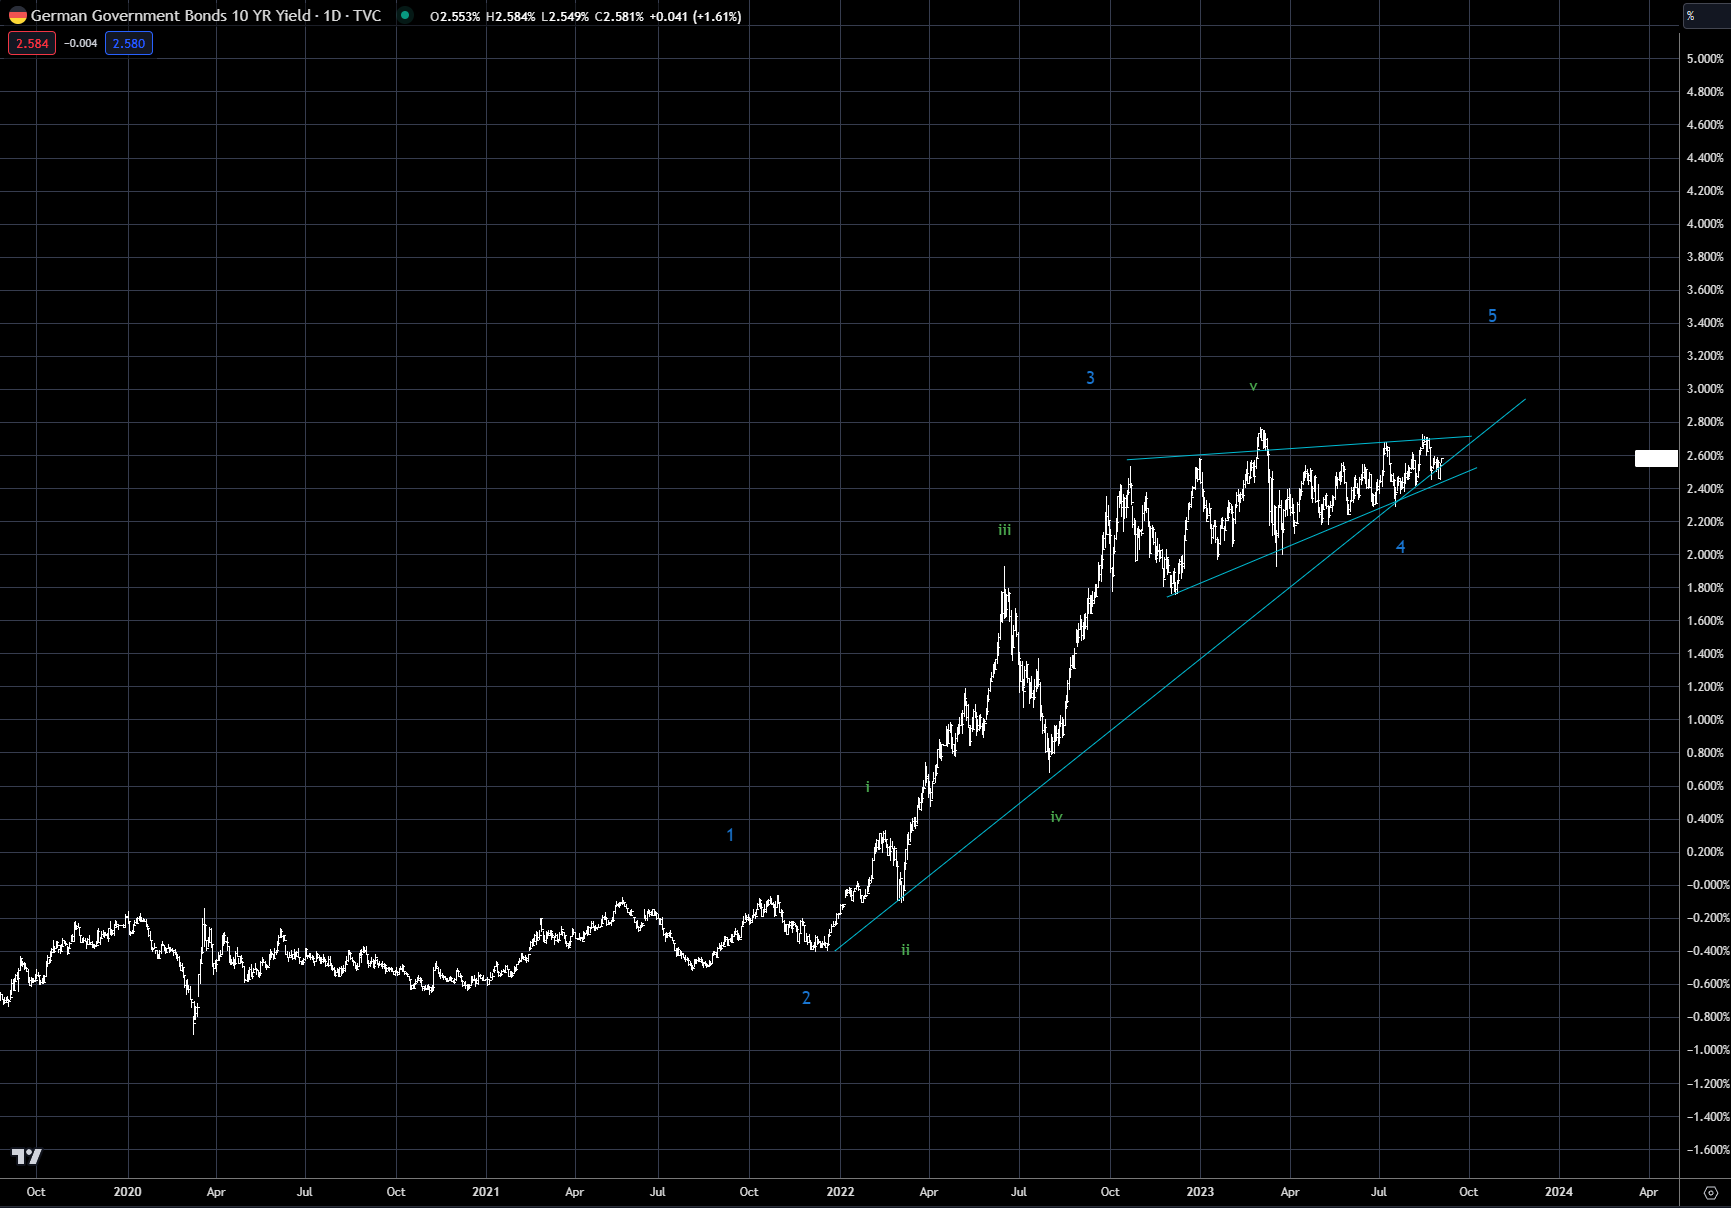
Chart 7: Supercore inflation
Last week’s discussion was about energy product prices spiking due to a refinery fire, while this week crude oil rallied after OPEC continued to keep supplies tight. Oil is clearly breaking out of its sideways congestion, marked by the horizontal blue line, with last week's price action taking it to new highs for the year. The overall trend is quite strong now, with upside price projections near the $100 range not out of the question. This will also continue to exert upside pressure on overall CPI data globally.
XLE, after breaking below its long-term uptrend, has now moved back above (see chart 9). Look for further gains in the oil majors. OIH, the oil service ETF (see chart 10), made new highs for the move last week, leading the oil ETF markets.
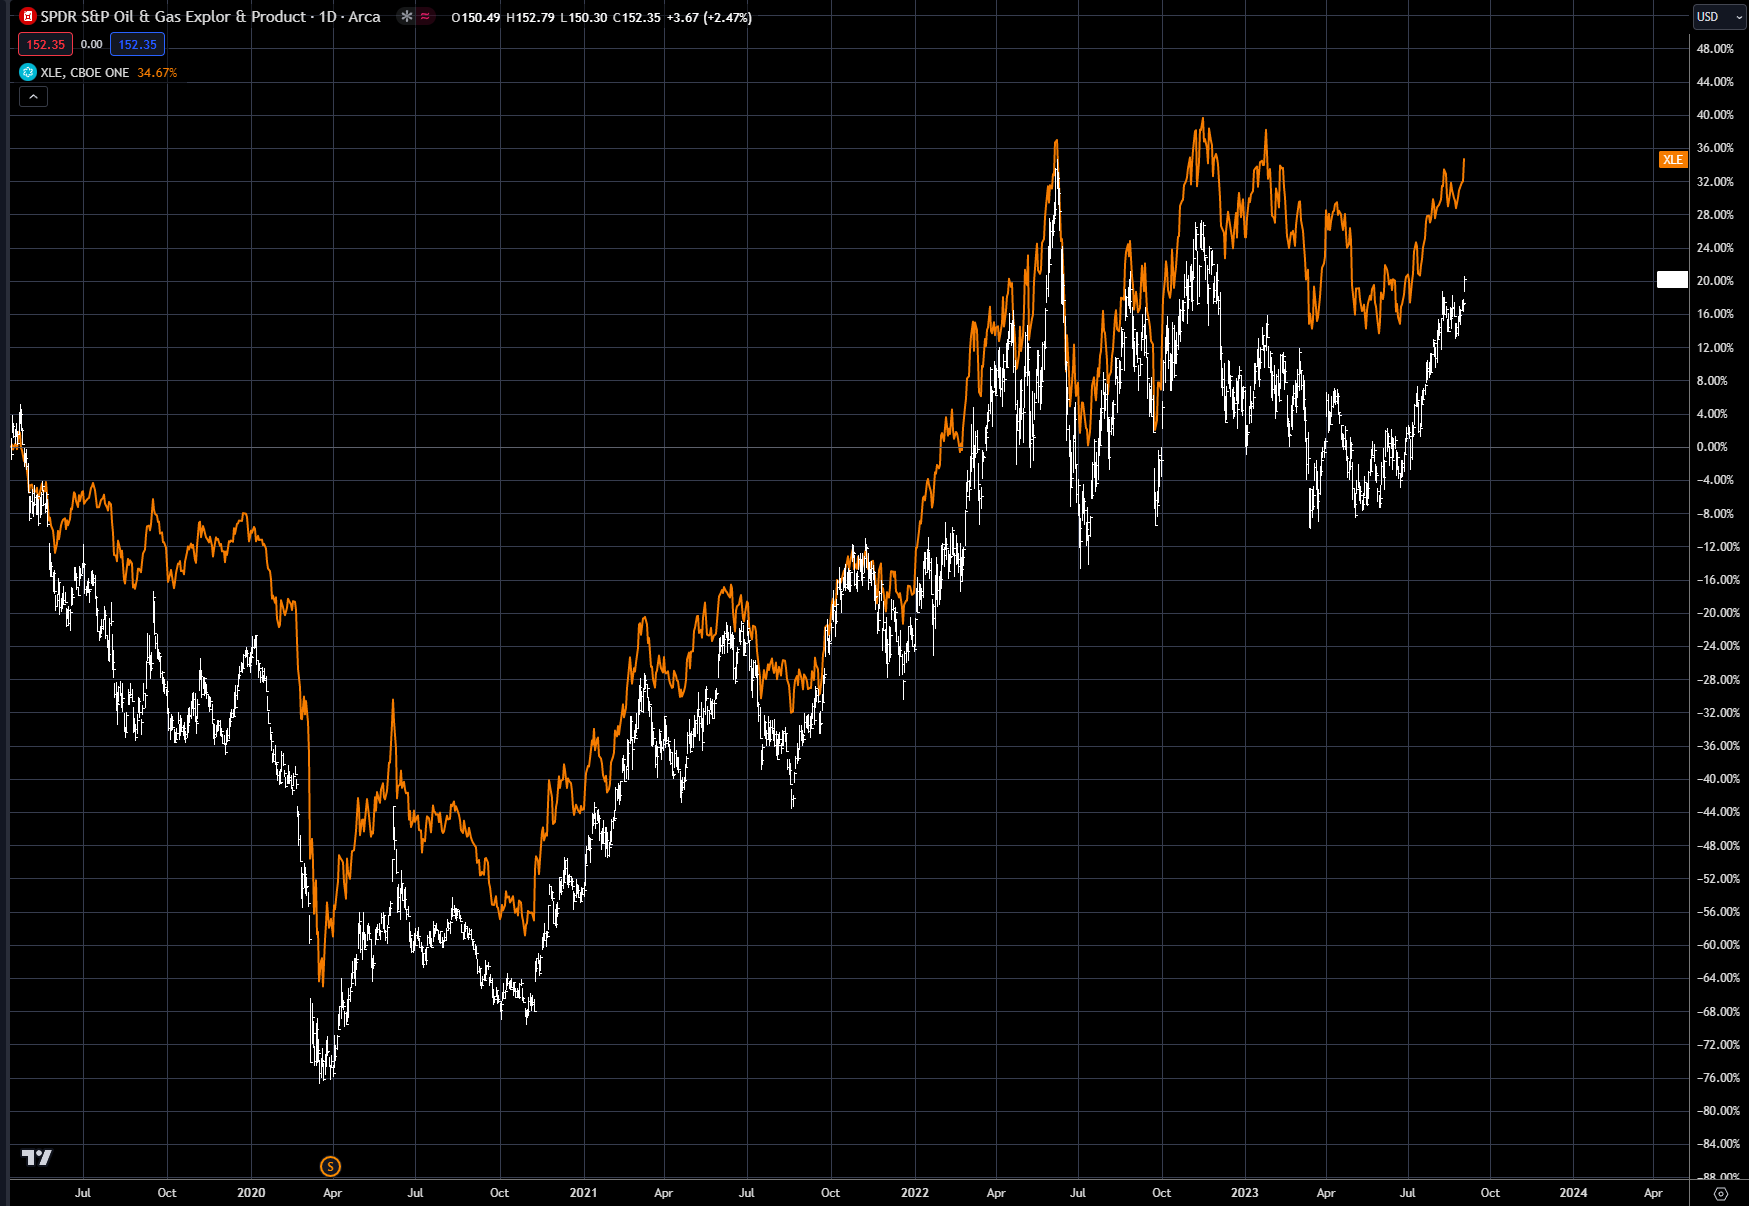
XOP, the oil producers ETF, did not make new highs, but is also looking quite strong, and is highly correlated to XLE (see chart 11).
Chart 8: October Nymex crude oil
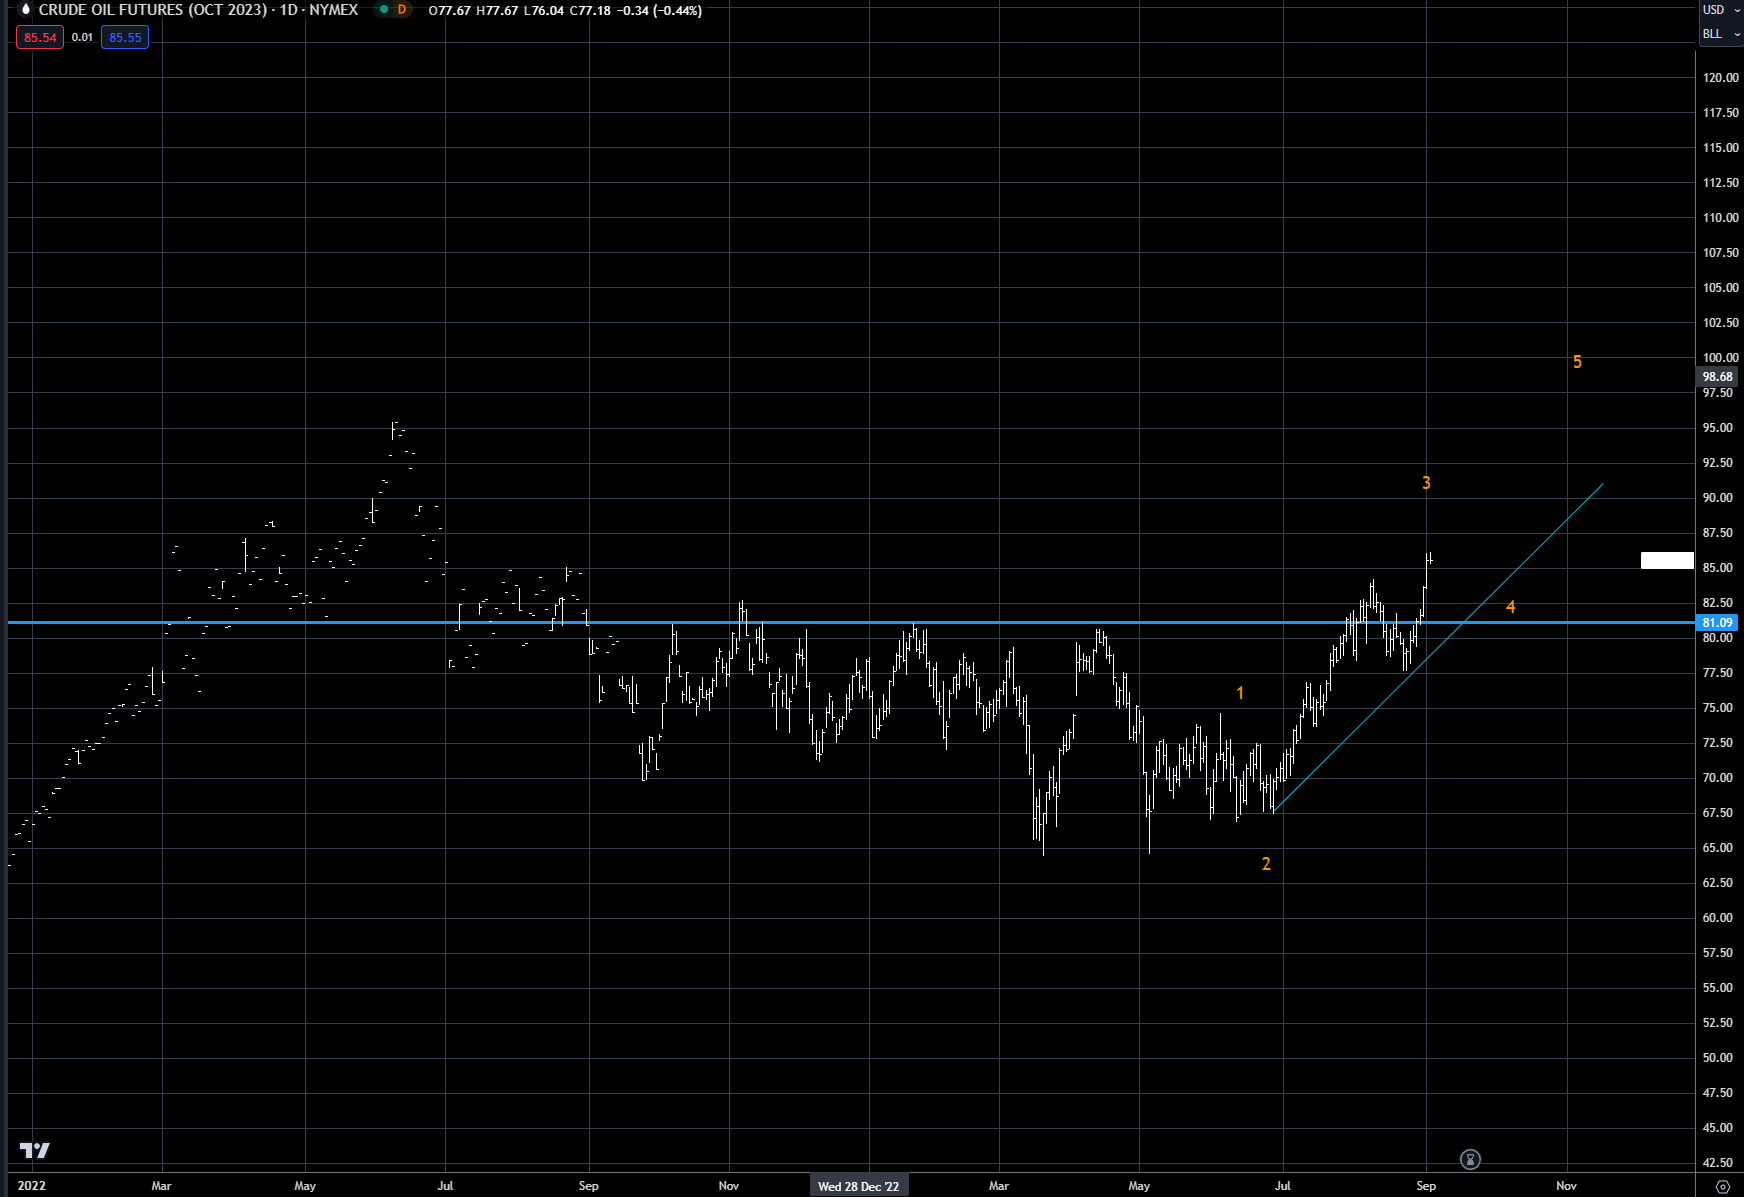
Chart 9: XLE
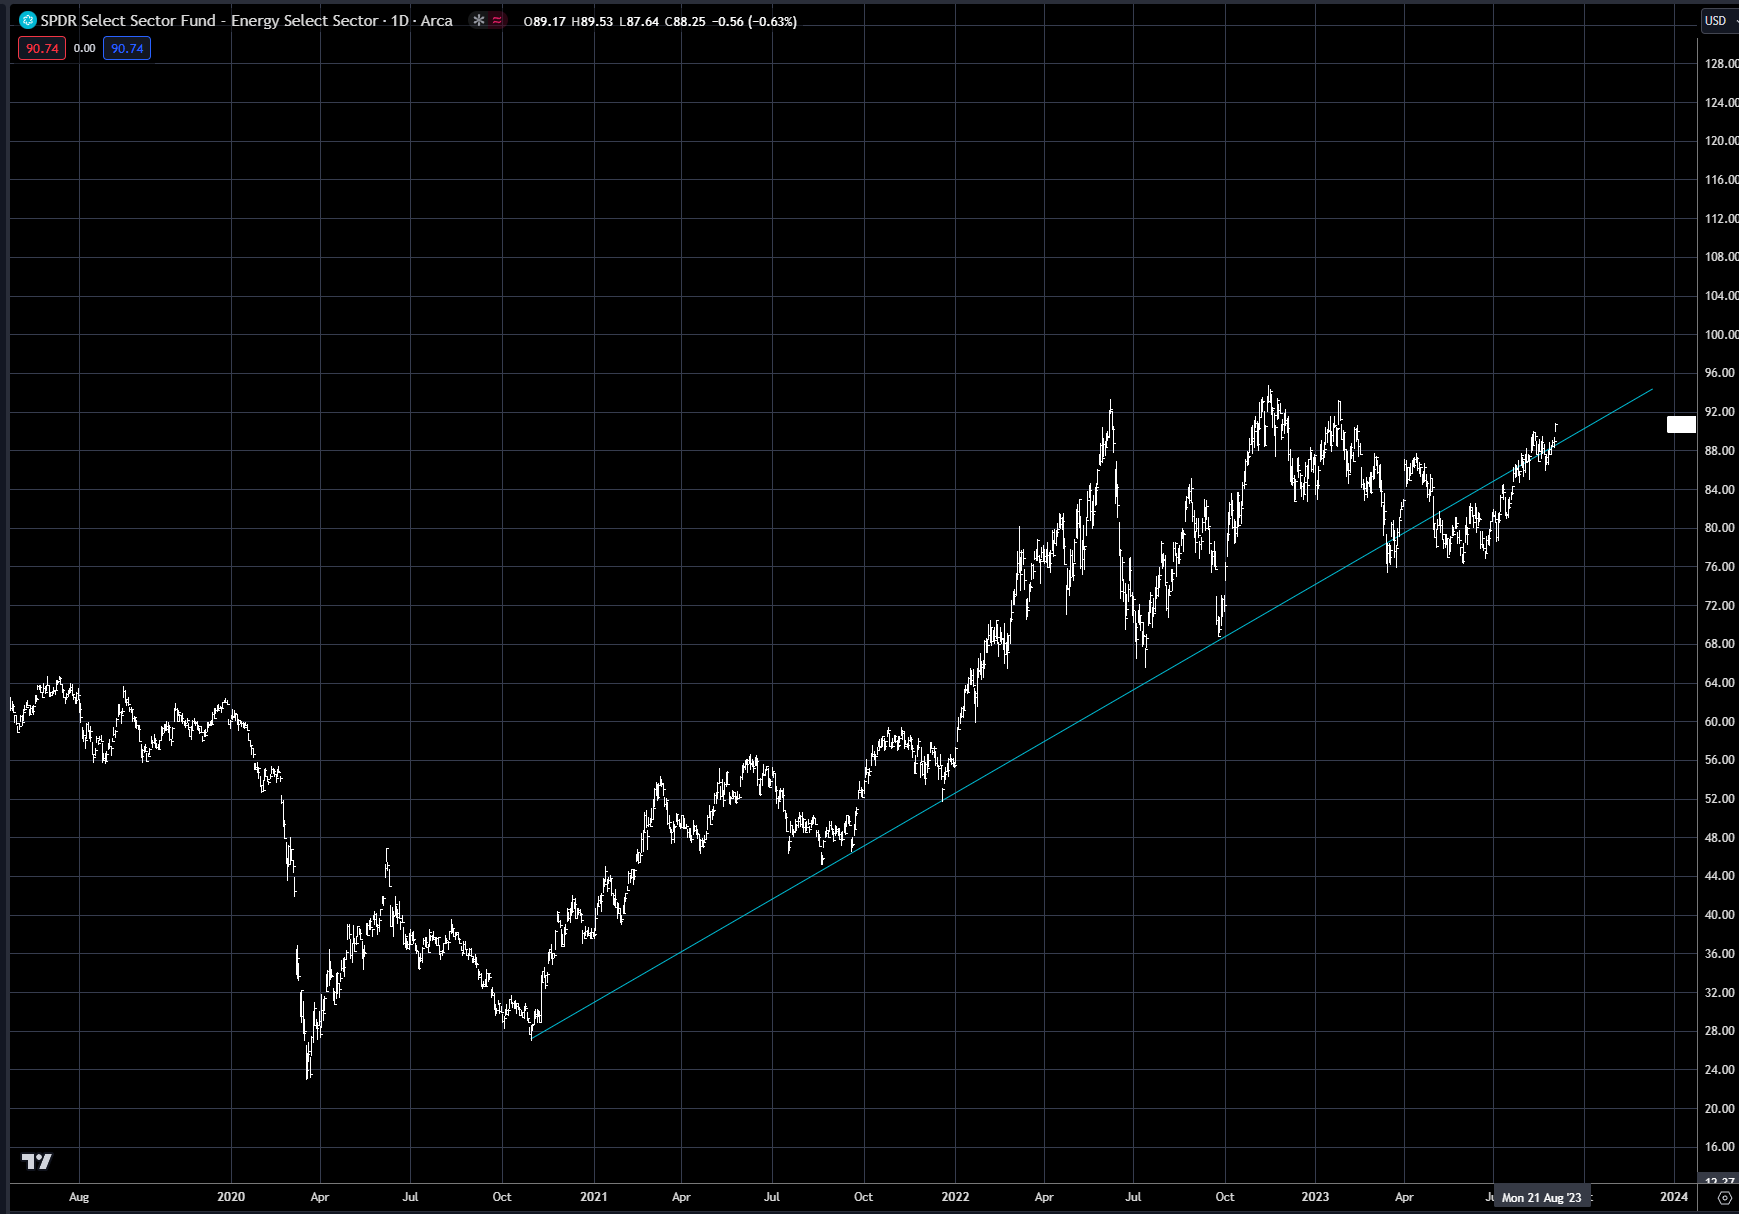
Chart 10: OIH
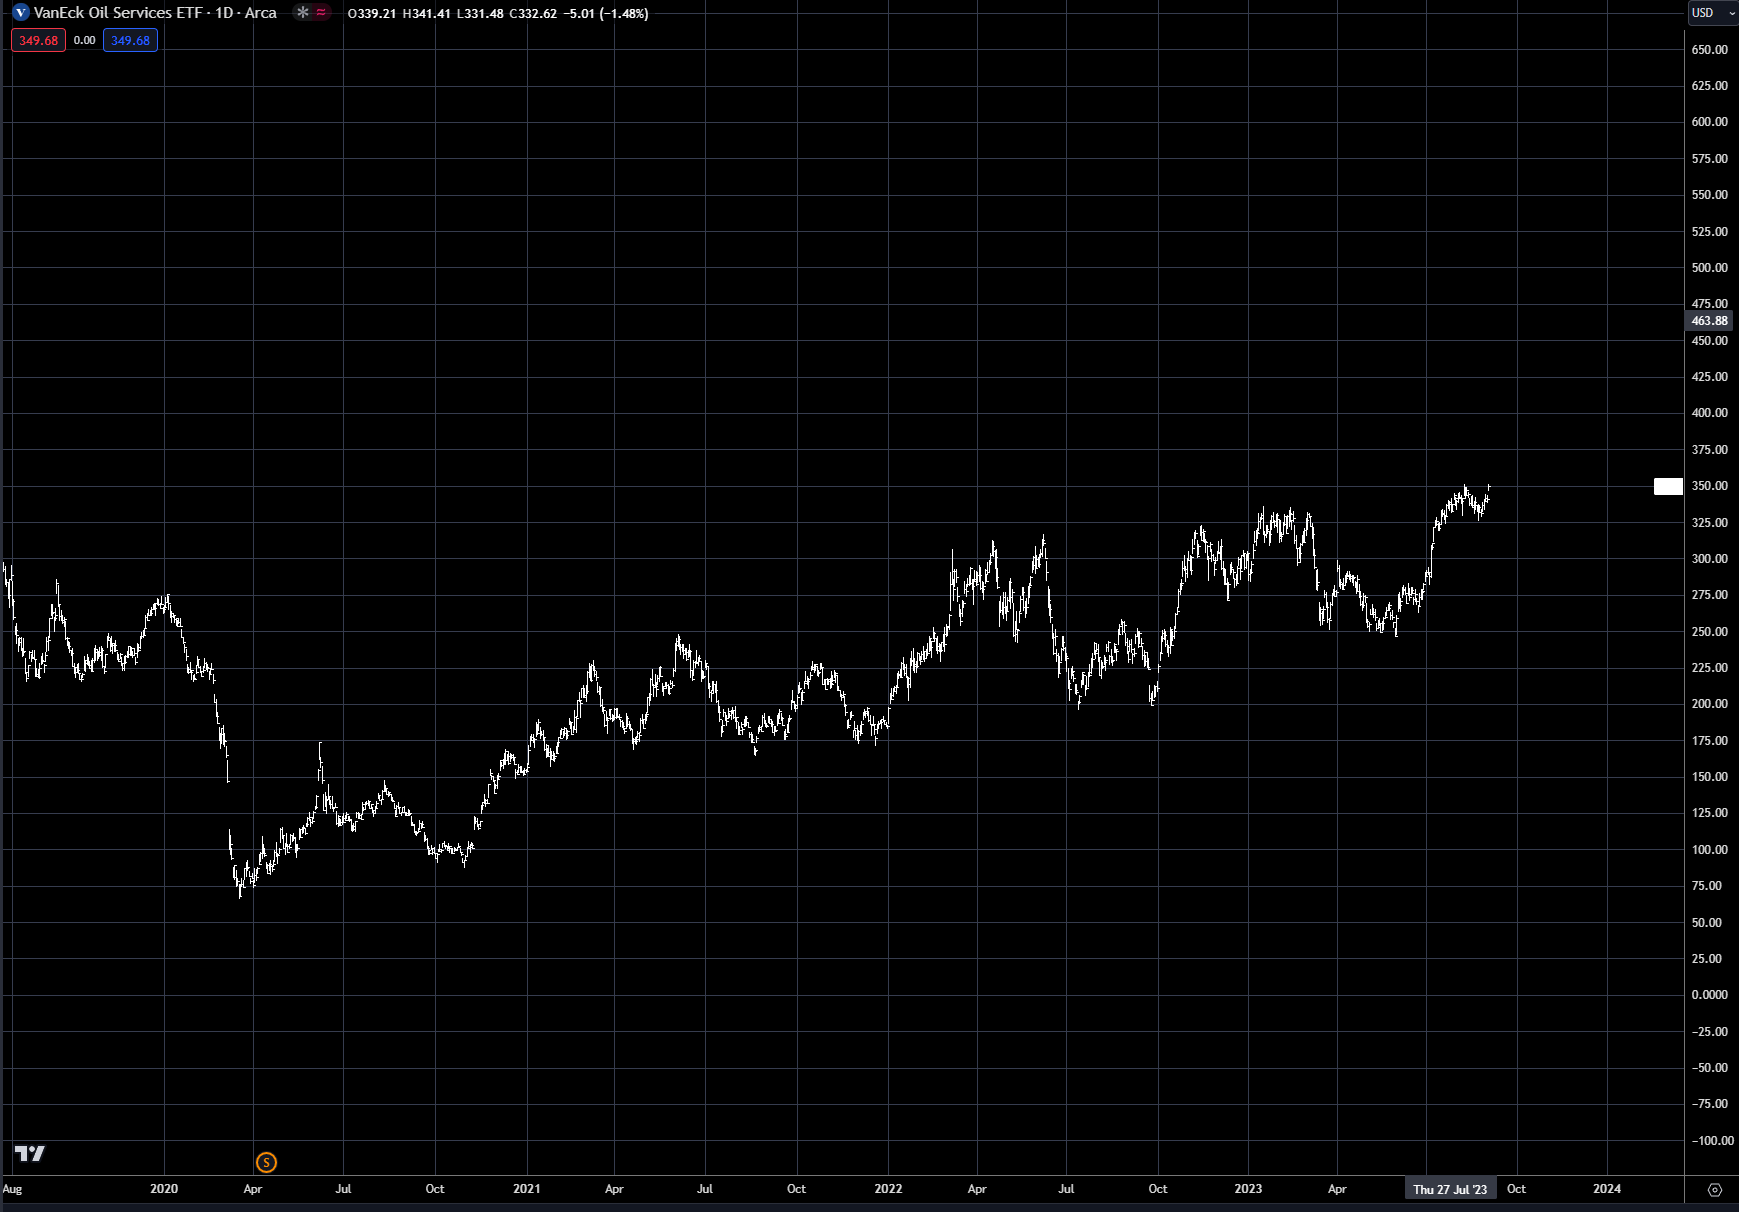
Chart 11: XLE overlay with XOP
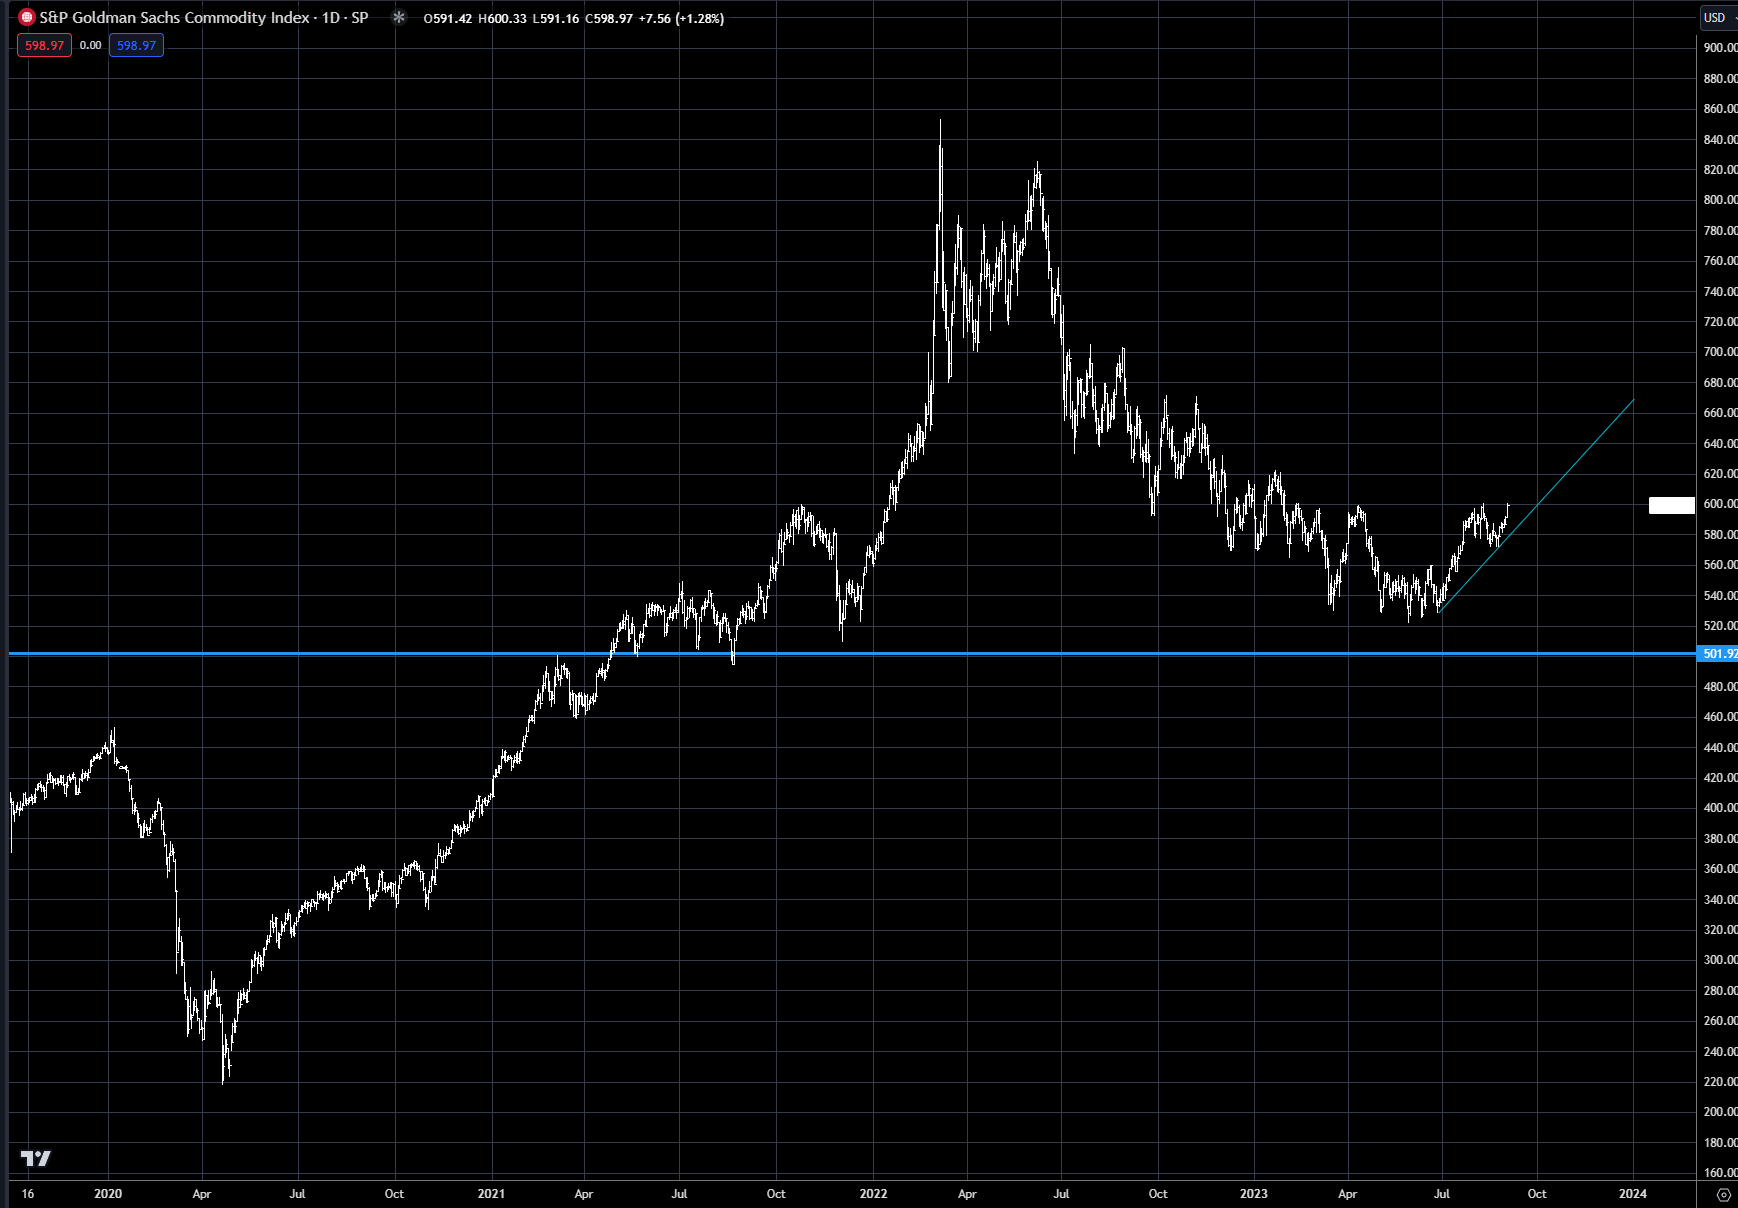
To finalize this week’s piece, the overall commodity index is close to breaking out to the upside, with the short-covering rally in commodities just getting started, as discussed in previous weeks (see chart 12). The 600 level in the index is the key resistance, which could be broken in the next week or so.
Chart 12: S&P GSCI commodity index
Trading strategy is based on the author's views and analysis as of the date of first publication. From time to time the author's views may change due to new information or evolving market conditions. Any major updates to the author's views will be published separately in the author's weekly commentary or a new deep dive.
This content is for educational purposes only and is NOT financial advice. Before acting on any information you must consult with your financial advisor.