The Crisis of Aging

Author: Bruce Liegel
The birth rate has been collapsing almost everywhere, with the exception of a few countries. Chart 1 below shows the global fertility rate, with the majority of the world at less than two live births per woman or the replacement level. Where this begins to really impact things is down the road – over the next 25 years, as outlined in the dependency ratio in Chart 2.
Note that the acceleration in the trend will take place in the next five years. Unless the birth rate changes dramatically –very quickly – or immigration from the high-birth-rate countries increases, many of these countries will be heading into financial destabilization. The remaining workers will not be able to support the number of retirees in the system, leading to a number of unwanted alternatives. The French government's political firestorm with the changing of the retirement age from 62 to 64 is just a taste of what is coming.
Chart 1: Total fertility rate
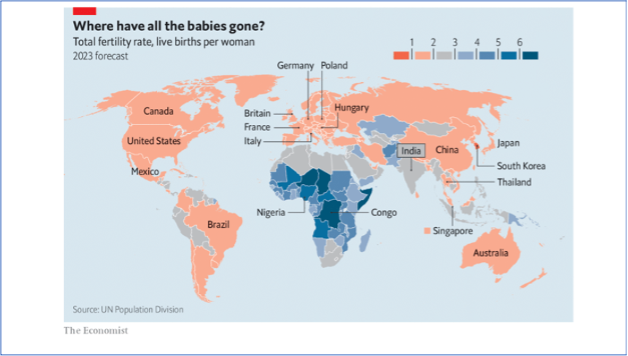
Chart 2: Dependency ratio
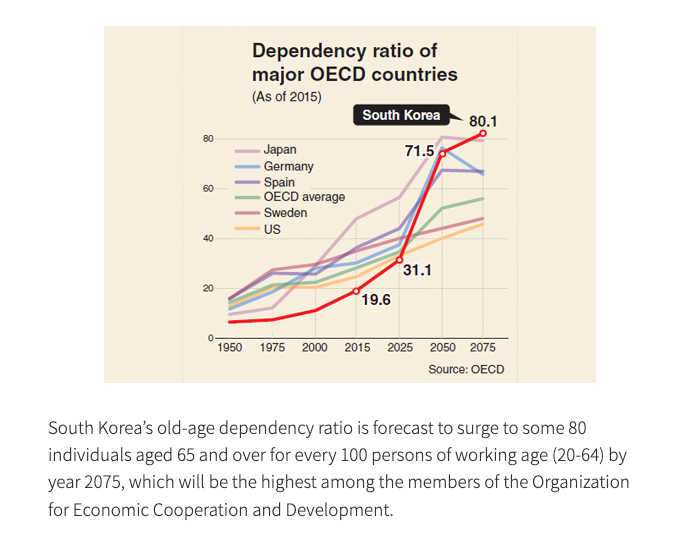
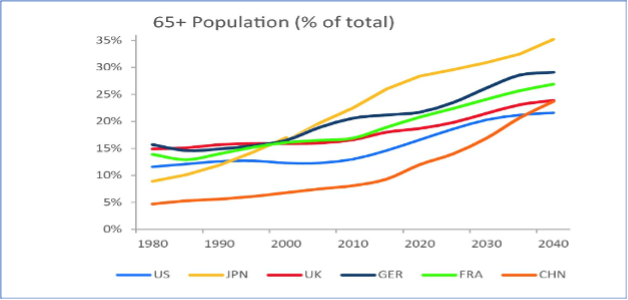
Chart 3 lays it out a bit differently, but explains how the over-65 population will continue to grow as a percentage of the population over the next 10-15 years, putting stress on the social welfare system setup for retirees.
Chart 3: Proportion of population aged over 65 (UN Population Statistics)
A brewing financial crisis
In the US, the retirement shortfall is getting little traction in Washington DC at the moment. As usual, politicians wait until the actual crisis is at hand before a solution is concocted to get the problem worked out. Chart 4 shows the timeline for when the issue becomes a financial problem. It is common knowledge that the crossover between the amount of money coming into social security and the amount going out is in about 10 years. While the general account at the Treasury keeps track of the Social Security Fund, the money is just that – a book journal. Meaning the actual social security payments come out of the cash flows generated by the social security tax.
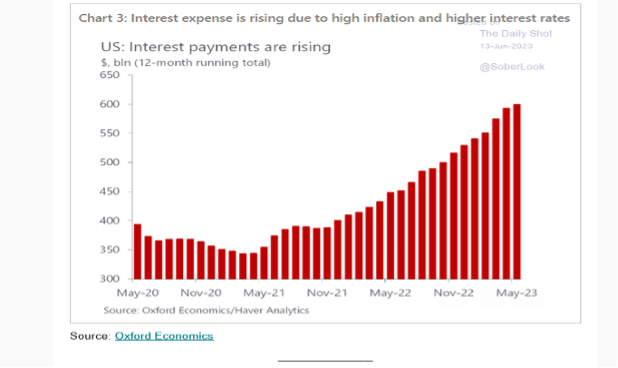
Chart 5 lays out the revenue and expenditures for the program back to 1980 via the Social Security Administration (SSA) website. Technically, the fund is already in a deficit, and has been since around 2020, but a fictitious interest-income adjustment keeps it looking solvent until 2032 or so. The reason the accounting is mystifying is that the overall debt of the government does not generate any interest income, but a huge and growing interest outflow. Chart 6 shows the current interest payment liabilities for the US government. With the Federal Reserve tightening policy, interest payments have increased from the mid $300 billions two years ago to approaching $600 billion today.
Chart 4: Social Security reserves
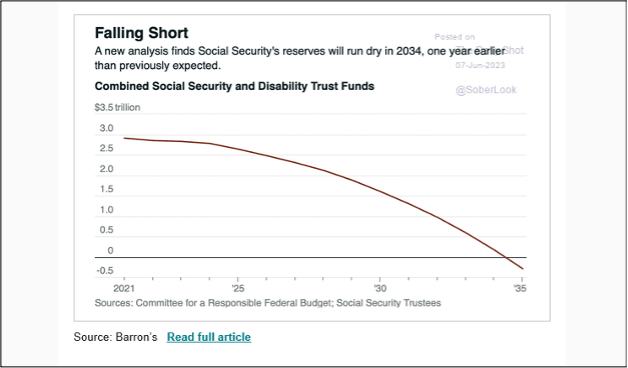
Chart 5: Old-Age and Survivors Insurance (OASDI) trust fund cash flow
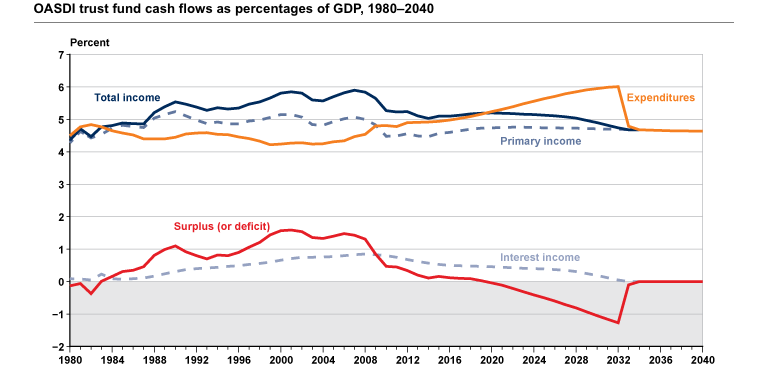
Chart 6: US interest payments
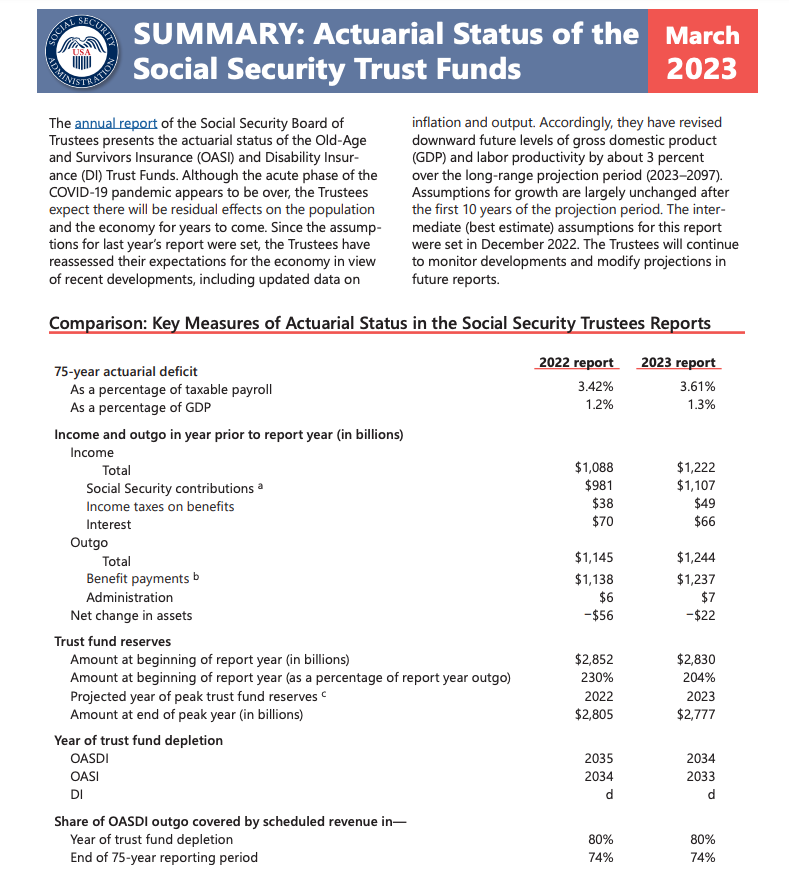
The actuarial status of the SS trust fund is laid out in Chart 7, and is the most current information on the program. The depletion date for the fund is estimated to be 2033-34, which is the same information as indicated in Chart 5 above (from the 2013-14 report). This report does a nice job of showing the current income statement for the SS trust fund, but the reserves once again are just a book entry with the Treasury – there is no real money stashed away.
Chart 7: Actuarial status of Social Security trust funds
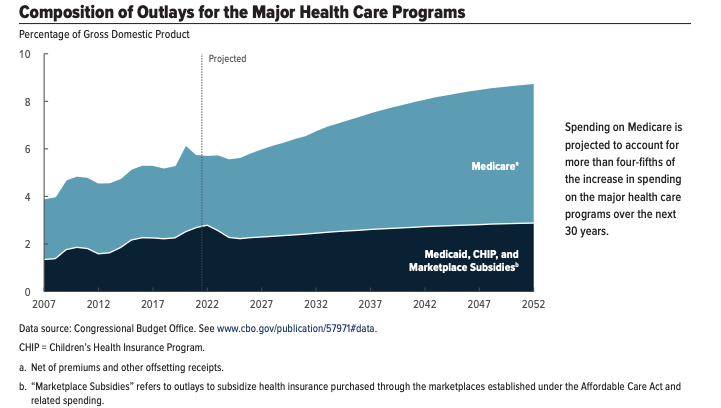
The Congressional Budget Office (CBO) has been publishing data on the coming crisis in social security and Medicare for a number of years, so it has the attention of Congress, just no political action. In Chart 8, the CBO runs out projections for outlays for both SS and Medicare. In our previous look via the SSA data, it was just a snapshot in time with projections for depletion, or when they require more funding. The CBO data show how the deficits get worse as time goes on and forecast those total costs to approach 8-9% of GDP by 2050. With current costs near 6%, that is an increase of near 50%. If we assume that GDP and total outlays grow at the same rate, that is still quite a large change.
Chart 8: Outlays for health care programs
The politics of debt
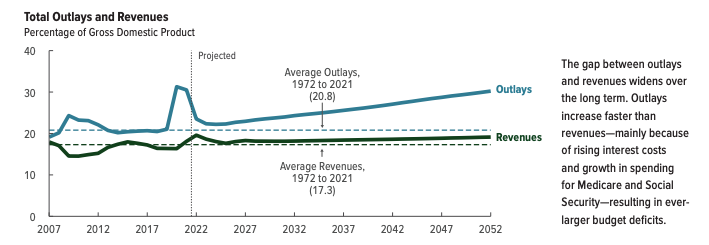
In July of 2022, the CBO published the 2022 long-term budget outlook, outlining the severity of the financial problems in the years ahead. This data is already a year old, with a new report expected out later this summer. In Chart 9 below, a very dire budget forecast is projected to meet all the required changes in federal spending. These outlays are for federal spending and they grow from 23% of GDP to 29% by 2050, while revenue growth is only slightly higher.
It's quite obvious that this is not possible. The question will be: how does Congress square the circle to keep the country running through this very difficult financial time period? Higher taxes and lower spending seem obvious, but the divided political parties will make this a battleground where the worst-case scenario cannot be ruled out. I’m not talking about default, but massive debt issuance, which will cause tremors in the foundation on which this country is built.
This will lead to the crowding out of private investment and be another factor behind interest rates going higher over the next 5-10 years. No one knows how much debt the system can handle. Japan has proved that over the past 20 years – but can the entire system run that much debt? I think that paradigm is going to get tested in the next 10 years.
Chart 9: Total government outlays and revenues
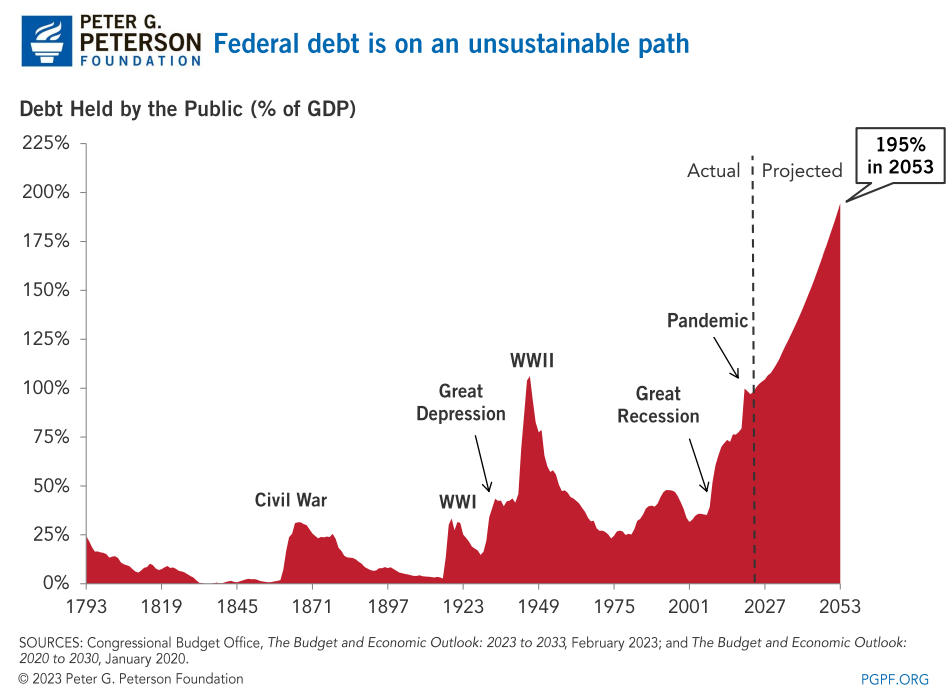
When you look at social security and Medicare as standalone issues, both would be manageable in a normal economic environment. But as Chart 10 shows, these are not normal economic times. Federal debt as well as global debt, as discussed in earlier deep dives, has been growing dramatically since 2000. The Peter G. Peterson Foundation has been on top of the debt issue since Mr. Peterson wrote 'Running on Empty' in 2004, sounding the alarm on the growing debt issue. He was concerned about the path we were on in 2004, when the debt was still relatively low – if he were alive today!
Chart 10: Debt held by public
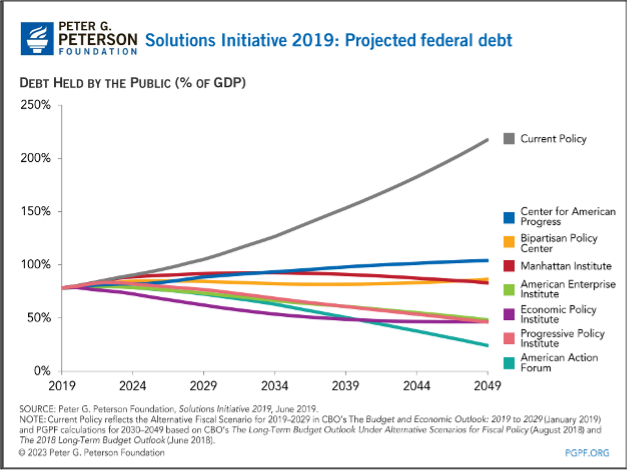
The CBO runs some future estimates on the total debt-to-GDP ratio, based on growth estimates and also the future path of interest rates. Chart 11 shows the paths based on changes to these assumptions. The takeaway is that everyone in Congress is not expecting the debt ratio to go down over the next 25 years. There are no reasonable estimates that shows the ratio declining from the CBO or other private estimates, although there are a number of Washington DC institutes that have put out solutions to remedy the future path, as seen in Chart 12. I am not going to dig into the plan that each of these solutions requires, but for the most part, a polarized Congress will have tremendous difficulty implementing any of these solutions until they are forced to.
Chart 11: Federal debt projections
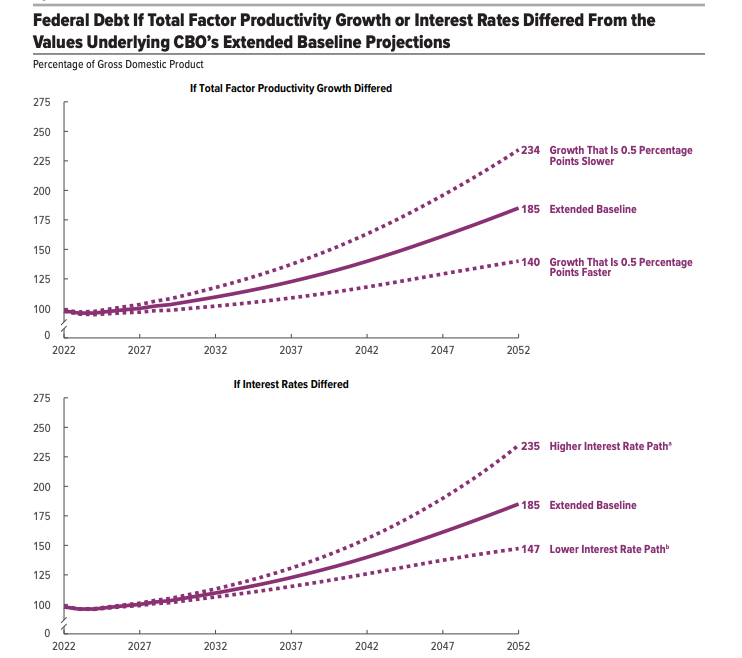
Chart 12: Debt projections based on think tanks' solutions
Debt and entitlement spending: a global problem
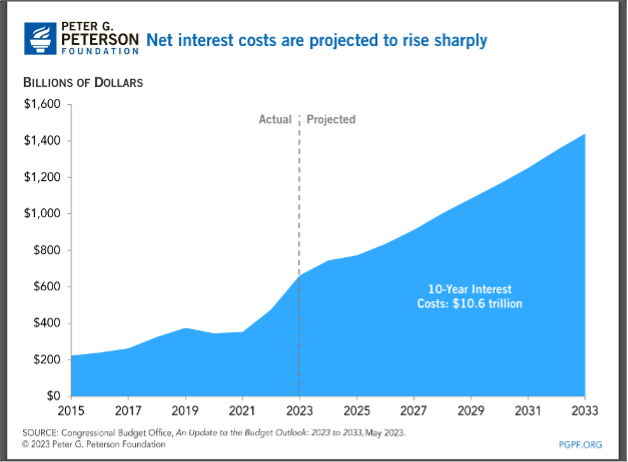
It's quite obvious to most market watchers that we are heading into a generational storm, and not just here in the US. The amount of growing debt, and the costs of entitlement spending, have the potential for this to be a global crisis. We have touched on the growing debt issue, but with interest rates now rising, the impact on deficits will only be magnified. Chart 13 shows the amount of interest costs on the debt, based on CBO estimates. This chart from the Peterson Foundation only goes out to 2033, but it shows how interest costs will rise from $200 billion in 2015 to an estimated $1.4 trillion in 2033 – it only gets bigger the farther out we go. In our previous deep dive, The Carry in the Conundrum, it was argued that the long-term trend in interest rates has reversed and is now heading up. If that is the correct analysis, the estimated interest on the debt could be quite conservative.
Chart 13: Net interest costs
If we tie all this together, it spells large future deficits to plug the spending gap, as shown in Chart 14. These long-term deficits will crank up the Federal Debt ratio to close to 200% of GDP by 2050, as estimated by the CBO. Some would argue that Japan’s current ratio is north of 200% already, and has had little impact on their economy, with interest rates below 50bps. Inflation is beginning to rise there, so this monetary experiment bears watching, as once the genie is released from the bottle, things may follow the path seen in Argentina pretty quickly. If you hesitate on this comment, just review what happened in the Weimar Republic in Germany in the 1920s. If you want to read a quick article on how their inflation rose 50% per month, read more here. I’m not suggesting Japan is heading into a Weimar Republic situation, but I think we have already seen the historical low in interest rates and inflation globally for the next 25 years.
Chart 14: Spending gap
A tighter global labor market puts pressure on wages, savings
As outlined in our previous two deep dives, the working demographics have changed and we should expect a tighter global labor market going forward. The retiring Baby Boom population is another segment that is adding pressure to the labor market in the US and Europe. Chart 15 below shows the timeline for retirees in the US, with the rate now accelerating into 2030. This is not a small amount, as retirees will increase from approximately 40m in 2010 to over 70m in 2030.
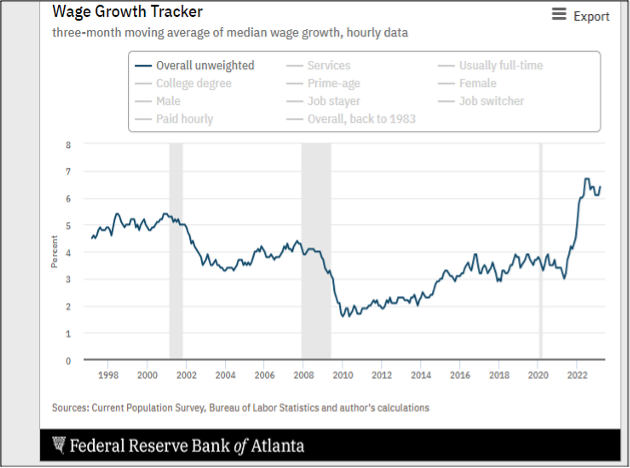
This is another factor for upward wage pressure, as shown in Charts 16 and 17 for both western Europe and the United States. Since the low during the pandemic, wage growth has been approaching a 6% annualized rate in the euro zone and is at or above 6% in the US. Other reasons for labor still being quite tight were described in our previous deep dive, The End of Cheap Labor.
Is this a wage spiral? Probably not, but I don’t see wages declining either due to all the demographic arguments we have laid out.
Chart 15: US elderly population
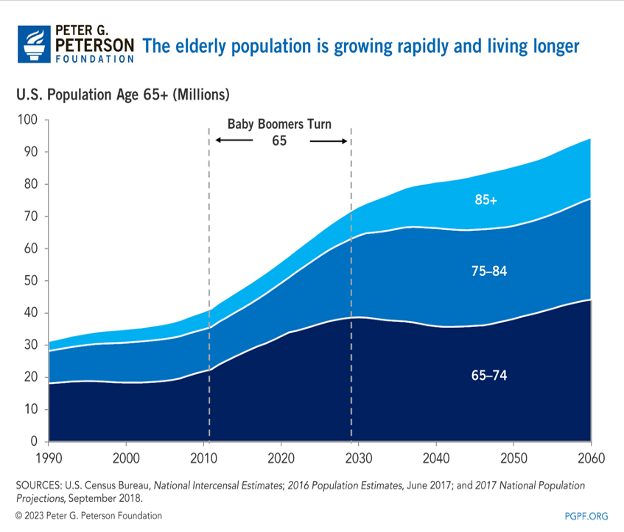
Chart 16: European Wage Growth
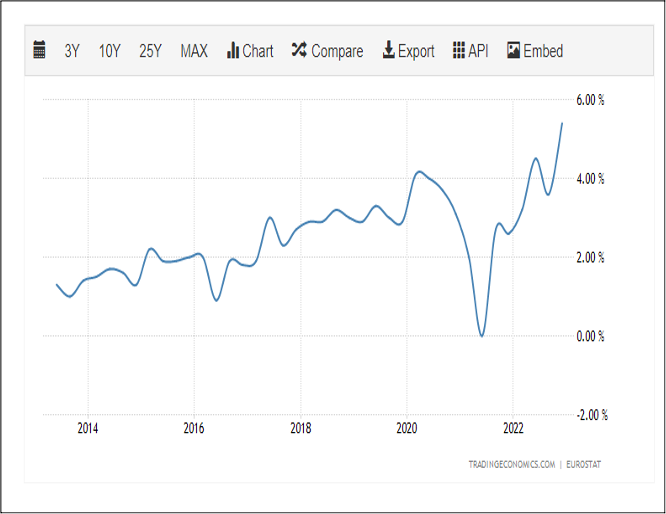
Chart 17: US Wage Growth
While inflation is coming down year on year, the fact is that the overall cost of living has increased dramatically over the past two years and real wages have not kept up. That is why wage growth is going to be sticky: the average worker is not getting ahead, and each day is a struggle to make ends meet, let alone save for retirement. According to the Economic Policy Institute, the median retirement savings for all working-age households in the US is under $100,000, while the Federal Reserve says the average American has $65,000 in retirement savings, and that by retirement that amount is $255,000. With social security and Medicare at risk, as outlined earlier, what is the end game?
Inflationary cycles
I have argued in the previous deep dives that I expect a series of higher interest rates and inflation over the next 10-15 years. Chart 18 shows monthly CPI inflation (the blue line) from the Bureau of Labor Statistics and I have circled the two previous inflationary cycles that the US has had over the past 125 years. The first period was approximately from 1932-1947, and the second from 1965-1981. If this phase started in 2020, the end of this inflationary cycle will end in the mid 2030s, at the same time as social security goes negative.
Chart 18: US Inflation Rate
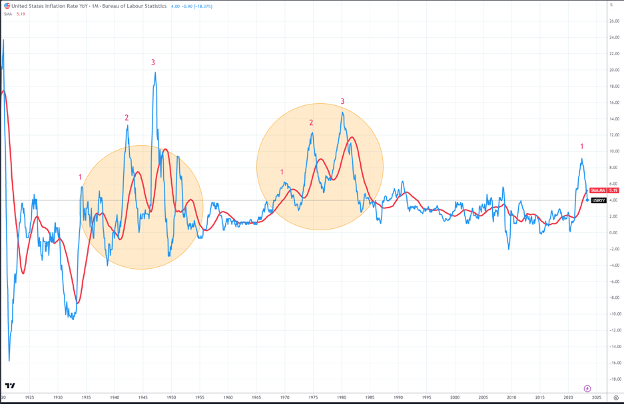
Notice that each of the previous inflation cycles occurred with three upward waves, and that the cycles lasted 15-20 years. I have labeled the current cycle (2020 low) with the first wave now complete, with expectations for 1-2 years of base building before the next up wave (2) begins. The red line is the 36-month moving average and it is still moving upward. Why 36 months? Because monetary policy has a long lagging effect, and the impacts from the first tightening cycle have not turned down the longer-term inflationary impacts yet. In both prior inflationary cycles, the 36-month average turned lower prior to the next leg higher. This is also the reason central banks are still in tightening mode – they want to see the long-term impacts from their tightening cycle.
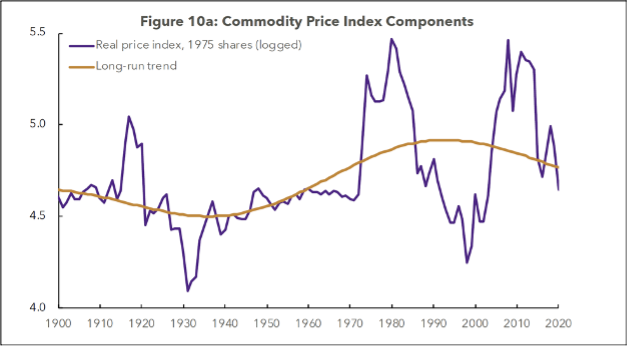
The updated version (2021) of the Chartbook of Real Commodity Prices has great data to analyze the correlations between commodities and inflation. David S. Jacks is the author of the updated data series used in Chart 19 below. This series is quite relevant to our work from Chart 18 as it shows the two inflationary cycles from the 1930s and 1970s in real terms. If the analysis is correct, the mother of all commodity bull markets will be starting some time in the next 1-2 years, if not earlier. This super cycle is already getting talked about, as it is quite obvious that we risk vast shortages in a number of raw materials for the transition to electric vehicles and non-fossil-burning fuels. Weather over the next 15 years could also be quite volatile.
Chart 19: Commodity Price Index
So, where does that leave us?
Trading strategy is based on the author's views and analysis as of the date of first publication. From time to time the author's views may change due to new information or evolving market conditions. Any major updates to the author's views will be published separately in the author's weekly commentary or a new deep dive.
This content is for educational purposes only and is NOT financial advice. Before acting on any information you must consult with your financial advisor.