Oil: What a Fracking World
Author: Bruce Liegel
Executive summary:
- Oil prices rallied on the back of the OPEC agreement
- The refill of SPR will act as a bullish factor
- The drop in horizontal rig count, oil well productivity, and drilled uncompleted wells also contribute to the bull case
- Soaring labor and drilling costs in the US make shale oil less competitive to oil producers around the globe
- Oil market is overdue for a correction before its uptrend
Part 1: Oil Fundamentals
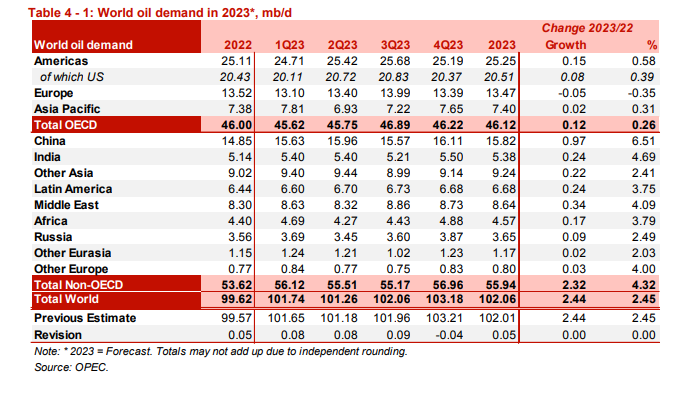
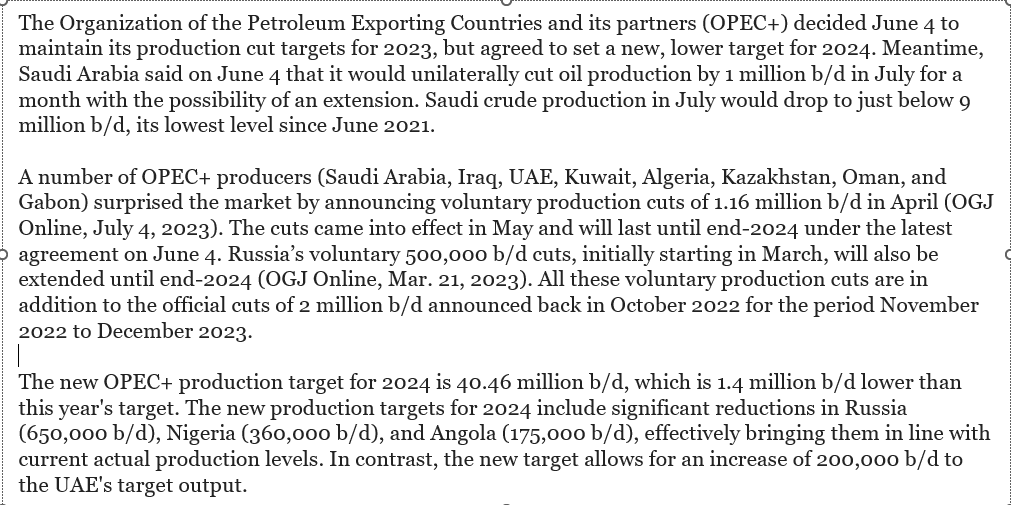
This is the third deep dive in our commodity series, this time focusing on the oil sector. Oil prices have rallied since June of this year when OPEC and Saudi Arabia continued to maintain their 1 million barrels per day (bpd) production cut. See detailed information on the OPEC cuts in Slide 1. Every month since they have rolled over this agreement, pushing oil prices higher.
Slide 1: OPEC Agreement
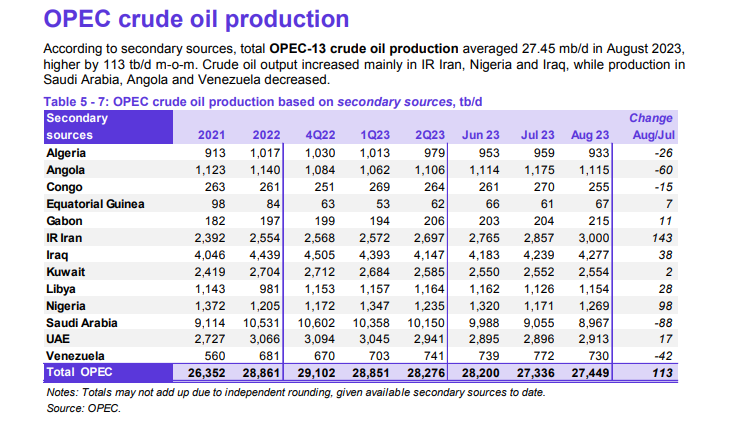
Slide 2 shows the historical crude oil production of the major oil producers in OPEC. There was a substantial drop in production during Covid, when global oil demand plummeted. Prior to Covid, OPEC's strategy was to pump at capacity and keep prices in a constrained price range to encourage oil demand. Covid forced OPEC to adjust this strategy and they cut production in a dramatic fashion. They had been slowly increasing oil production since 2020, until the recent new quota agreement.
With the Biden administration realigning the US energy policy and the Russian invasion of Ukraine, the political landscape has also changed. Both of these factors have been drivers to the oil price rally.
Slide 2: OPEC oil Production

Source: https://peakoilbarrel.com/2023/09/
There are a host of other factors driving the oil price higher along with the OPEC agreement and geopolitics. The focus of our research will be to dive into these other factors and explain how each is doing its own part in driving oil prices higher.
Chart 1 shows oil prices bottomed during the depths of the 2020 Covid outbreak, during the 2nd and 3rd quarter, as global demand fell with the shutdown of global economy. The market has been in a major uptrend since, with a market correction in 2022 and early 2023.
Chart 1: WTI Oil Futures November NYMEX Futures
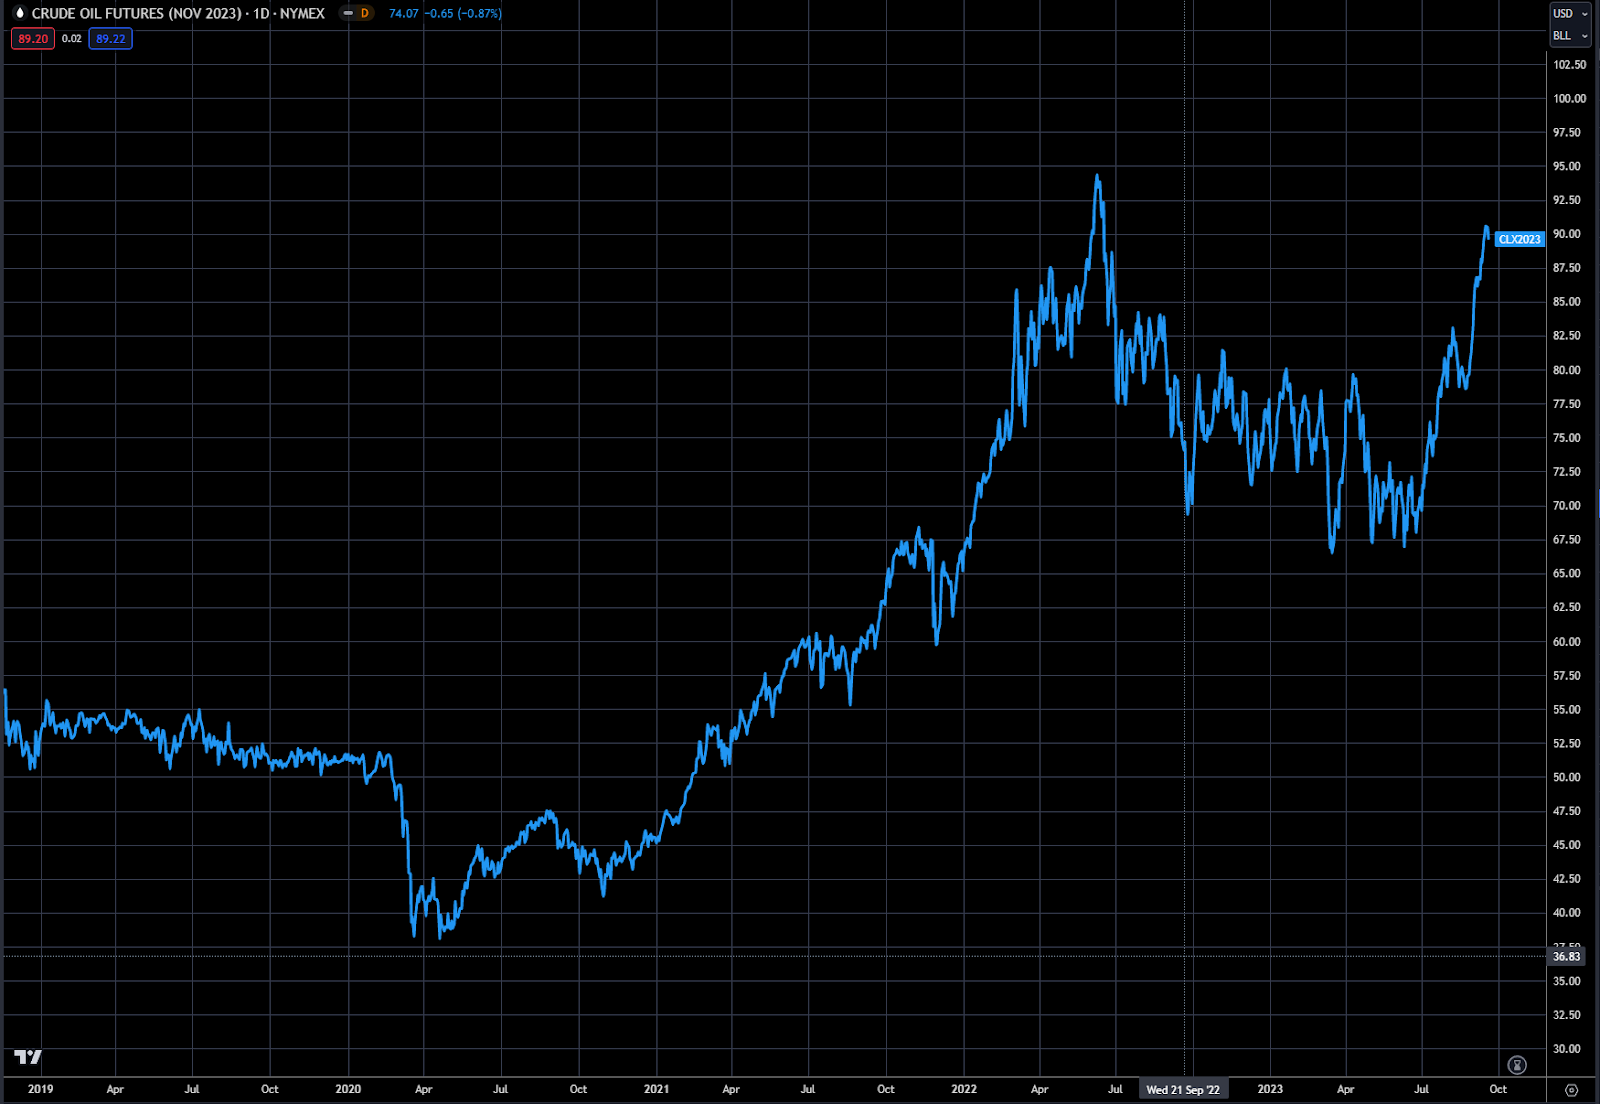
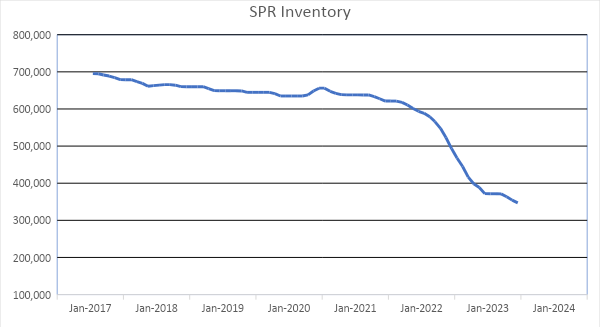
In Chart 1, the sideways price action from April 2022 until the summer of 2023 was primarily caused by the release of over 350m barrels of oil from the Strategic Petroleum Reserve (SPR) — see Chart 2. We could try to argue that higher interest rates globally would also impact energy demand, but the data is not verifying that, as global travel has been quite strong.
The SPR peaked at just over 700 million barrels, with some released during Covid, but the majority of the release started in April 2022 and ended in August 2023. The Biden administration was trying to subdue higher inflation by driving down oil prices, the release of the SPR was their attempt to cap oil prices.
At the end of August 2023, the SPR now has 350m barrels in storage. While the release put the bull market on hold, liquidating half the storage — intended for emergency use — has now put the US at risk if there is indeed a price spike due to a bigger geopolitical or exogenous event.
Refilling the SPR if indeed it is done, will now act as a price pushing factor, as the supply demand dynamics are enormously skewed to the upside. The original plan by the braintrust in Washington was to push the price lower and then buy the oil back — that plan has now put the DC elites on their backs, as they have added enormous risk to the oil profile going forward. This puts the next potential wave of higher inflation for the US and global economy front and center as we head into 2024-2025.
Chart 2—Strategic Petroleum Reserve in Thousand Barrels
Source: EIA
The Biden administration has made it quite clear that they want to wean the US economy off of oil and coal — this signal, along with regulatory actions, have had enormous impact on the oil drilling/fracking regions of the country. If you are not familiar with where oil is found in the US, Slide 3 using EIA data shows the main oil plays, led by the Permian Basin. The Permian has been the largest contributor to oil growth in the US over the past 10 years, and will continue to be the “play” going forward. It currently produces nearly 40 percent of all shale oil production in the US.
The advent of fracking opened up the supply of oil via the oil plays (Slide 3). Slide 4 shows the amazing growth of the shale plays, with production increasing from virtually zero in 2012 to over 4 million bpd today. But the shale oil YoY production growth is slowing, with production capping out over the last 3 years. Part of the reason for the slowing production is due to rig counts dropping, productivity declining, reduction in CAPEX, and drilled and uncompleted wells falling. Focusing on each of these components will help us understand the current production environment and what to expect going forward.
Slide 3 Main oil plays in the US

Slide 4—Oil production

Source: https://novilabs.com/permian-basin/
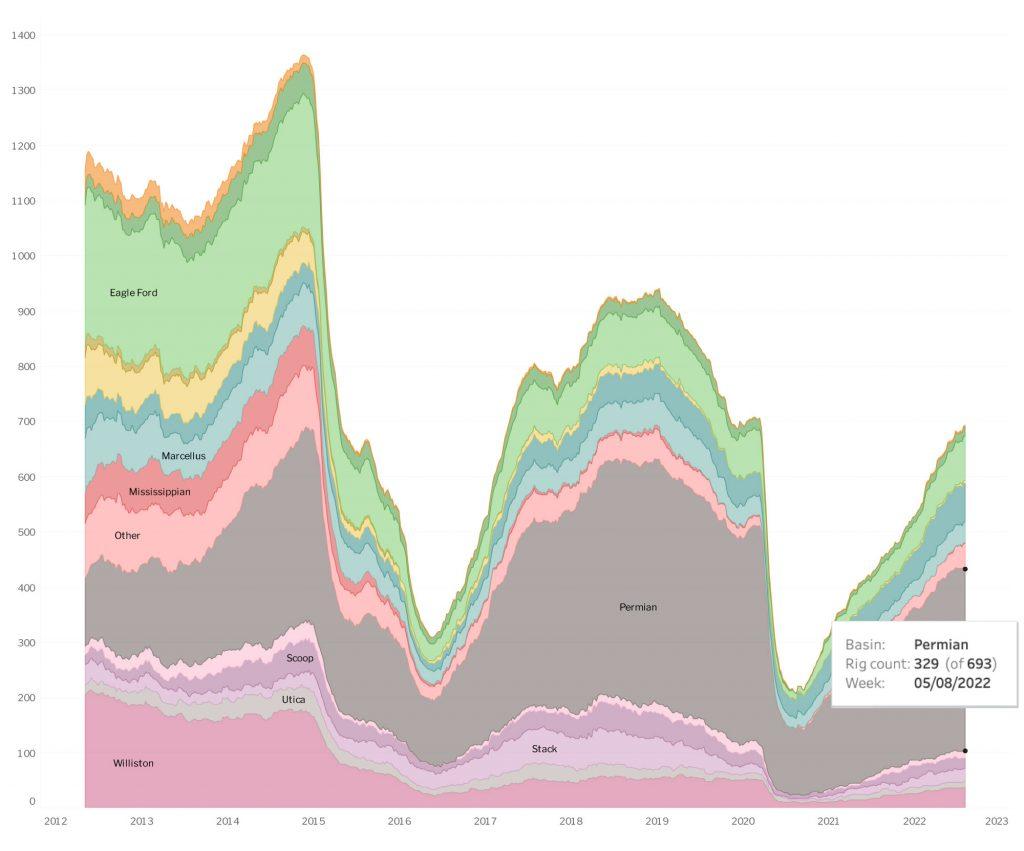
Slide 5 shows the current horizontal rig counts in the lower 48 states, in particular all the oil plays shown in Slide 3. There clearly is some cyclicality in placement of working rigs, with the troughs indicated by lows in the price of crude oil.
In 2014 the number of working wells exceeded 1300 at its peak, while the current number is close to 700 — almost a 50% decline. The Permian has also become the dominant play with over 50% of working rigs at work there.
While current rig count is up since the 2020 low, it significantly lags the last two cycle highs in 2019 and 2015.
Slide 5 Horizontal Rig Count
Source: https://novilabs.com/permian-basin/
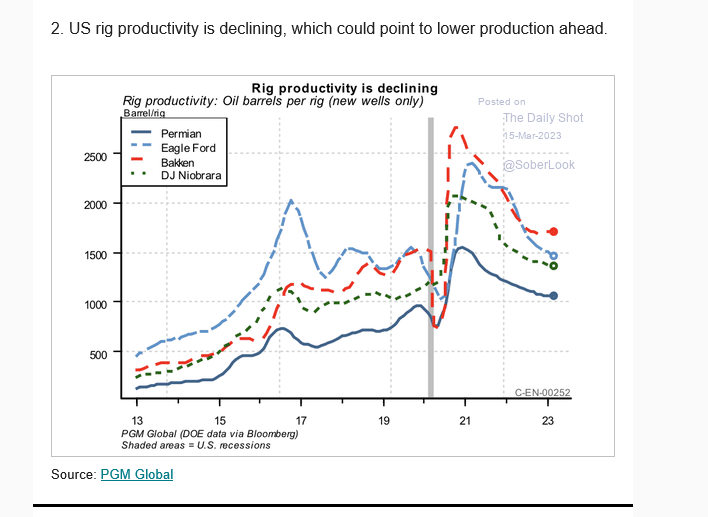
Slide 6 shows how the productivity of well production is flat over a 6 month period and Slide 7 shows that the overall production of new wells is declining dramatically. There is a lot of debate about productivity gains and losses for new drilled wells — with most believing that the best locations have already been explored, leaving less than ideal drilling locations left. The data makes a strong argument that this is accurate.
Slide 6: Average oil production per well after six months

Source: https://novilabs.com/wp-content/uploads/2023/09/Novi-industry-report-Sept-Q3-2023.pdf
Slide 7 Oil Barrels per rig
One of the most significant changes going on in the oil industry is the large drop off in drilled uncompleted wells (DUC). When a rig is available, drillers drill —even if the infrastructure is not completed to take away production. From the start, rigs kept drilling with the logic that the infrastructure would follow. This allowed for a large backlog of wells that were completed, but production was not flowing yet. This acted like a price cap over the market, it really was additional storage available to the market.
As Slide 5 showed, rig counts have been declining since the 2014 high — although the oil price rally since last year has resulted in more rigs working again. But because working rigs have been declining, the DUC well numbers have also been declining. Oil prices were held in check when there was a large number of DUC wells — that has now changed, especially in the Permian. Drillers need a price and regulatory incentive to go crazy again — price is getting there, not so sure about the regulatory part under the current administration.
Slide 8
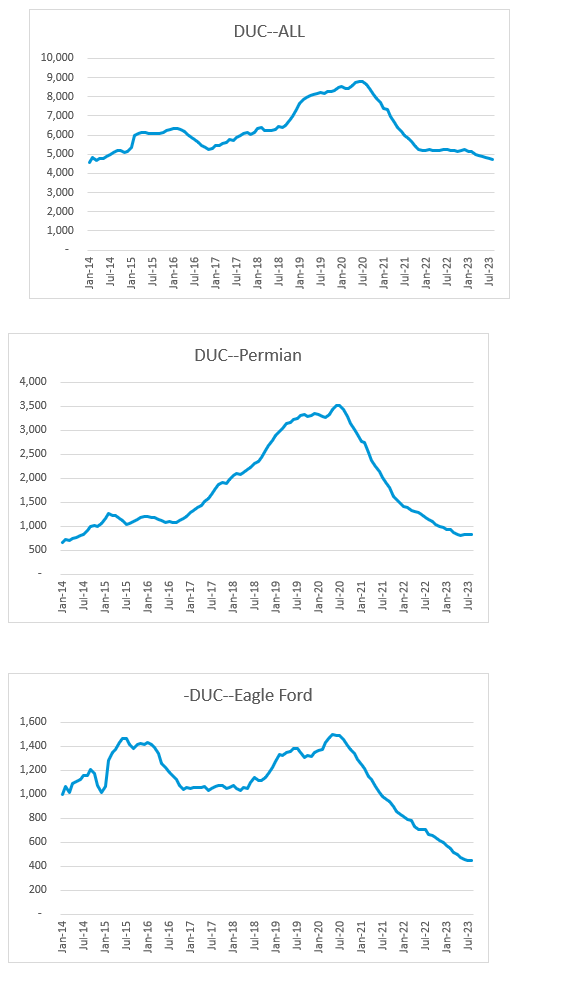
Source: EIA data
The main reason why drilling has fallen off is the dramatic drop off in investment since 2014 — see slide 9, which corresponded to the peak in horizontal rig counts from Slide 5. In order to get a second drilling renaissance in shale oil, large amounts of Capex is needed to encourage more drilling. Part of the problem for oil is that it is now considered a dirty resource and is not attracting the interest it did 10 years ago. A lot of the traditional energy investment funds are now flowing into green projects like EV, solar and battery storage. Also the profitability of many of the E&P companies was suspect during the initial surge in drilling 10 years ago, hurting many investors, giving them little incentive to invest again.
Slide 9 Capex for Oil drilling
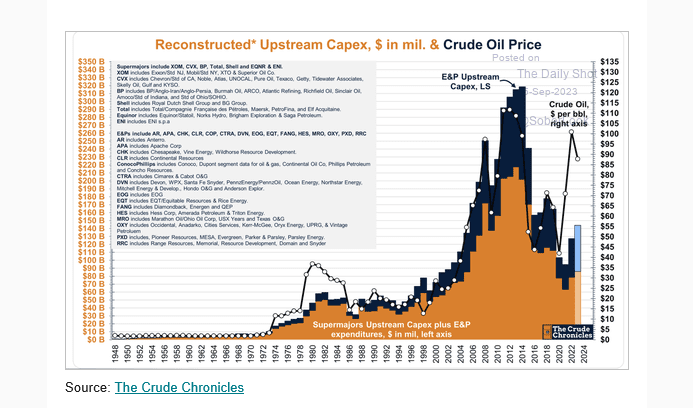
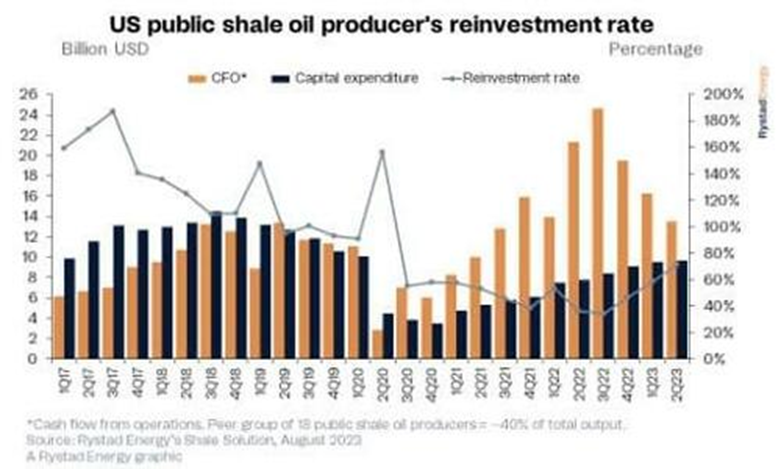
After the large decline in Capex which started in 2014, investment flows have flattened out over the past 5-6 years. But there is change on the horizon with the rally over $120 in 2022 resulting in a new surge in cash flow from operations (CFO) See Slide 10. This has resulted in the reinvestment rate rising , which hopefully will encourage outside investors to join in. The current rally in oil prices, now approaching $90, should only help with improving corporate profitability and also new investment for well drilling.
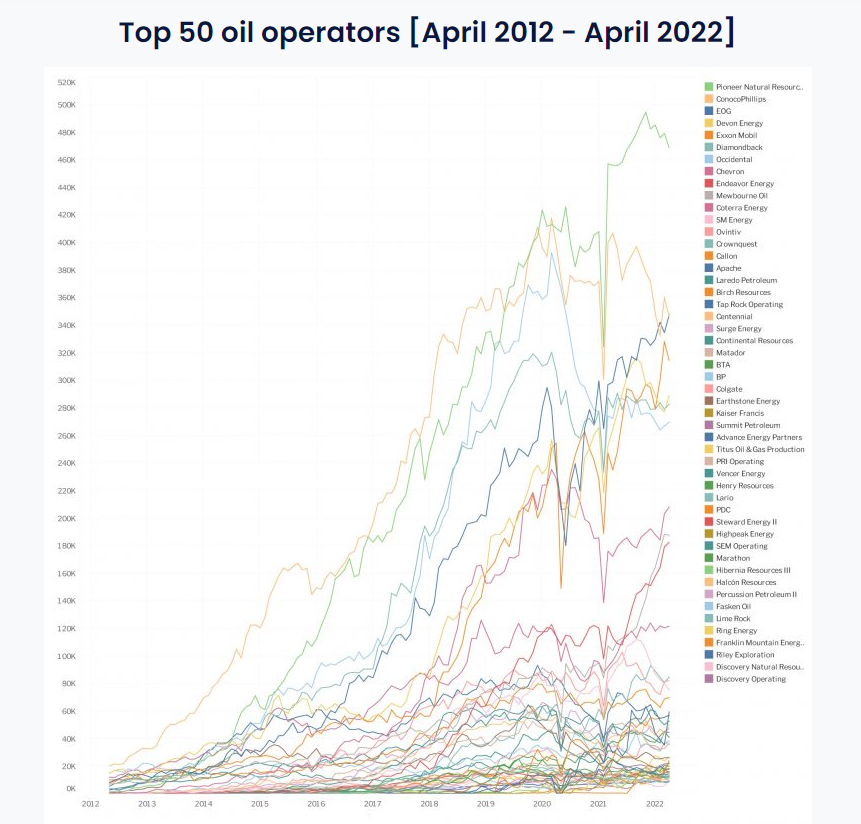
Slide 11 is more for information purposes, but lays out the top shale oil producers over the last 10 years, with Pioneer Natural Resources by and far the largest shale oil producer, followed by Conoco Phillipos and EOG.
Slide 10
Slide 11
Source: https://novilabs.com/permian-basin
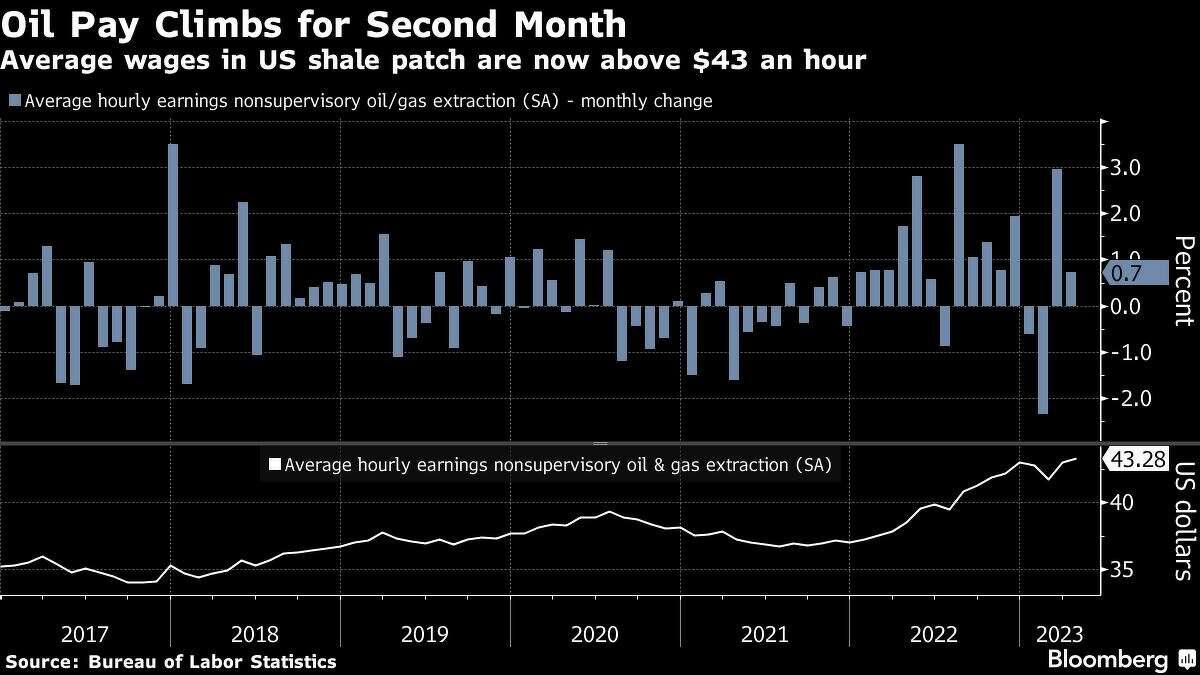
The last area to touch on is the rising wages and tight labor supply in the US as discussed in prior papers. The Oil sector is not immune to these drivers and as slide 12 shows, the cost of hiring has increased from the mid $30’s per hour to now above $43 in the last 5 years — a jump of over 20%. This has a direct impact on the cost of production, and makes shale oil less competitive to other oil producers around the globe.
Slide 13 shows just how large the employment picture is, with close to 350k jobs in the oil production arena, but down sharply from the peak in 2014. If there is going to be another shale oil revolution, the tight demographics and aging population will be an issue, pushing up the cost of drilling.
Slide 12
Slide 13

The last topic to discuss is the low stock levels of crude oil, distillates and gasoline. Slide 14 shows the stock levels via EIA data with the 5-yr range in the gray, and the current supply in the blue. In all three graphs, current supply is near the bottom range for the 5-yr average. Supply is tight, not only in the US but also in Europe.
To complicate matters, on September 21th, Russia announced that they will be banning the export of gasoline and distillates. This announcement initially caused the market to surge, but distillates and gasoline both fell on the day – indicating another sign of bearish divergence — and that the market is due for a pause/correction.
Slide 14—Oil stock levels

Source: EIA
Summary of Oil Fundamentals
We have laid out the bullish scenario for oil:
- OPEC reducing supply
- Reduction in SPR storage level, leaving less available for emergency needs
- Drop in horizontal rig count
- Drop in oil well productivity reduces long term supply
- Surplus of DUC wells sharply reduced
- Lack of direct upstream investment
- Soaring labor and drilling costs
- Current stock levels of crude oil, distillates and gasoline are low
Part 2: Market Outlook
Chart 1 is our base case for crude oil prices over the next 2-3 months, with the market overdue for a correction at this juncture. The pullback to the base trendline should be considered the ideal location, but the safest and best location would be the breakout level — indicated by the horizontal blue line. With the uptrend so strong, it is unlikely that we get that deep a correction. But oil can be quite volatile, so patience is important here. The upside target is still for much higher prices after this correction.
Chart 1 NYMEX October Futures Contract

Why the correction from this level? There are a couple reasons. First on Chart 2 we are approaching or met the 50% retracement level near $94.00. This is the first likely area where a bull market takes a pause in its uptrend. In Chart 3, the market is beginning to flash bearish divergence, with the distillate (ULSD) market beginning to weaken versus crude. This is indicated by the blue line (distillate) declining while crude (orange) continued to rally. Distillates have been the market leader for the past few months, and when the market leader begins to falter, normally the whole sector will flow suit.
Chart 2: Long term chart of Crude Oil
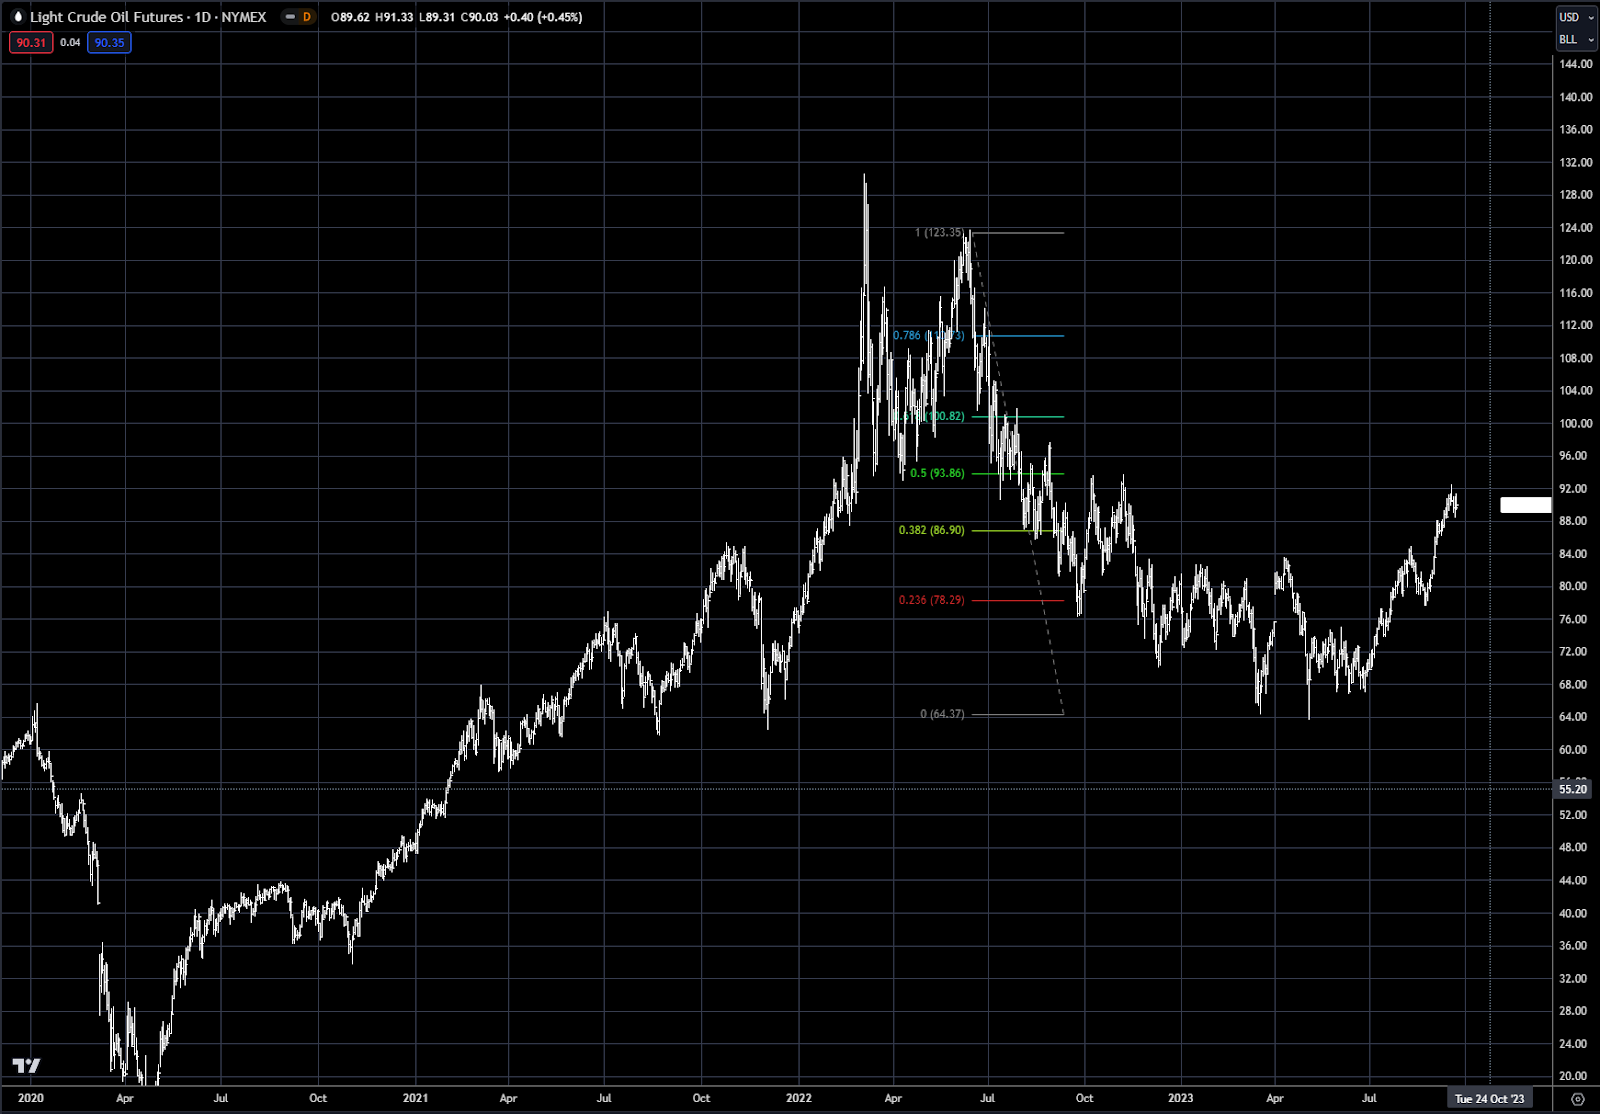
Chart 3: Crude Oil (Orange) verse NY Harbor ULSD (Blue)

Chart 4 shows more confirmation of this bearish divergence with the Dec Distillate crack spread beginning to turn over — or at least take a pause in the uptrend. The refining margin for distillates has been surging for the last year, with very tight supply due to lack of refinery capacity driving this market. One could expect that the last push higher has been supply building in anticipation of winter approaching — which could reduce forward demand, unless we were to get a very cold winter in the US and Europe.
Chart 4: Distillate Crack spread Dec ULSD/Dec Crude Oil
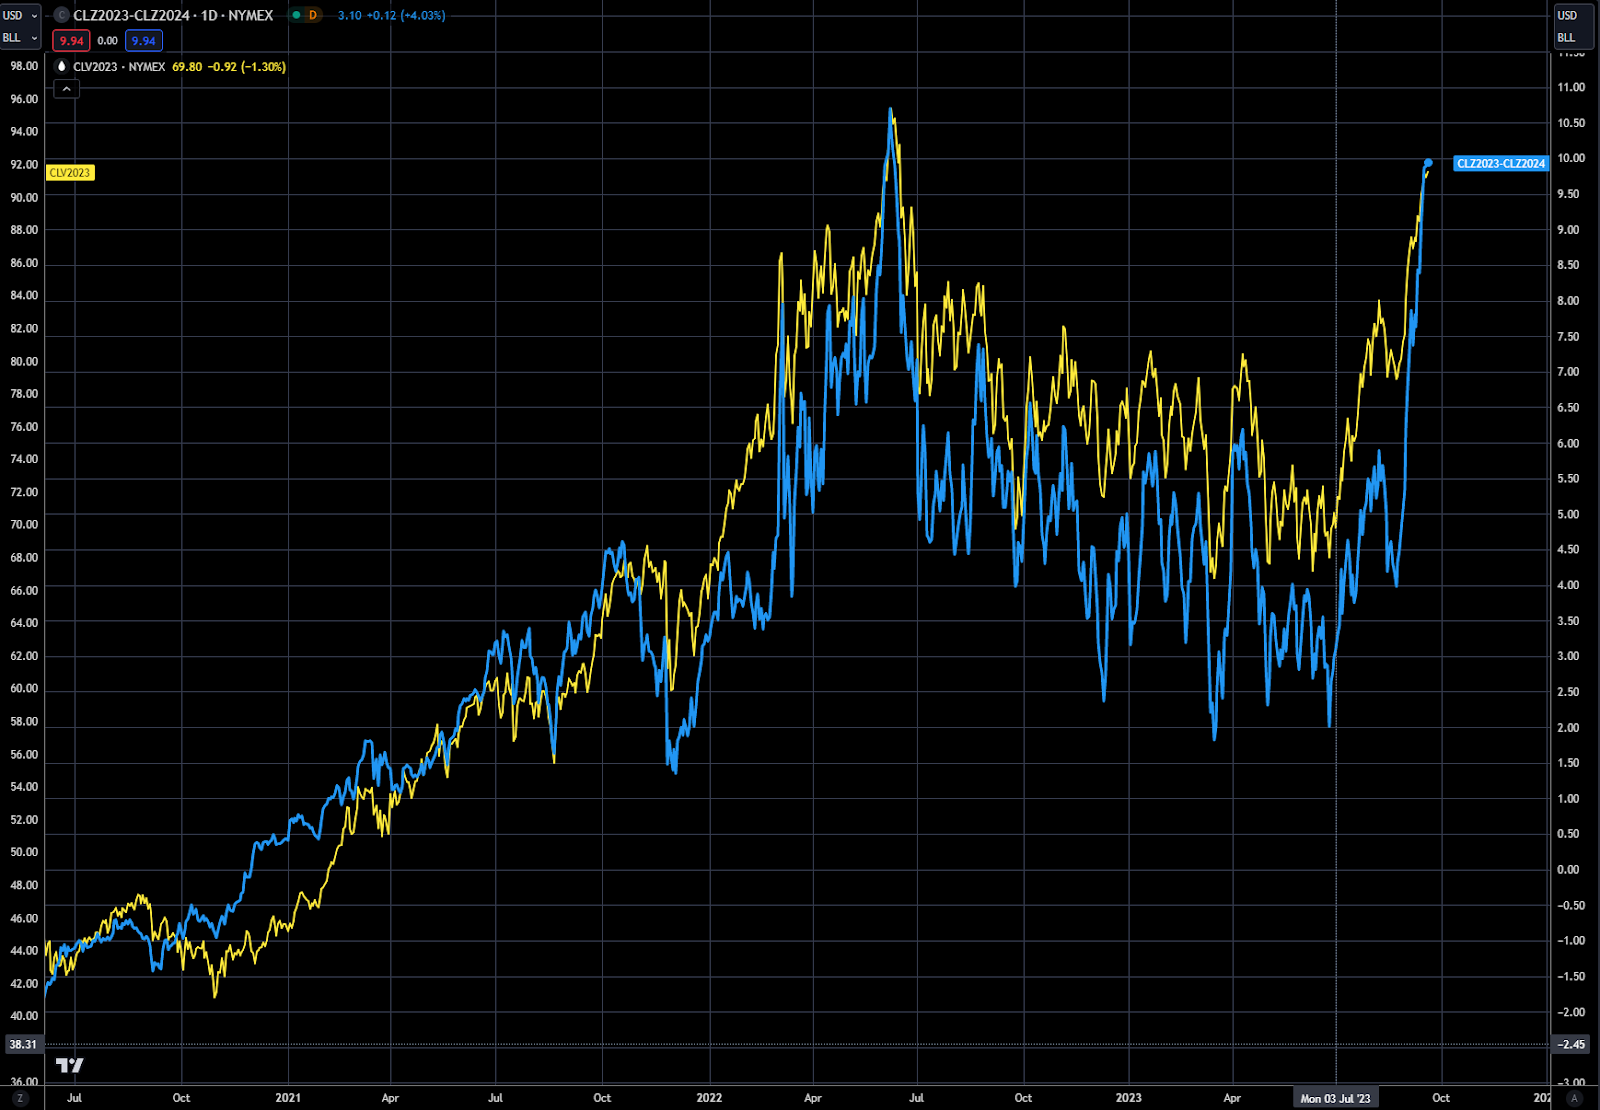
Forward spreads are another place to watch for divergent signs in the market. The underlying futures contract tends to be highly correlated with the forward crude oil curve. In Chart 5 you can see the tight correlation between the October Crude Oil contact (yellow) and the December 2023-December 2024 spread (blue). The curve of the market is always another way to play the direction of the underlying commodity, and this is typically true for most commodity markets. Watching for signs of divergence here is also a good indicator the market is getting overstretched. The Dec 2023 minus the Dec 2024 in Chart 5 is not flashing this divergence yet, but is something to keep an eye on. But please note that the spread is getting close to the highs from April 2022, when the market high was last made near $125.
Chart 5: Crude Oil-NYMEX October futures (LHS Yellow) verse December 2023-2024 oil futures spread (RHS Blue)
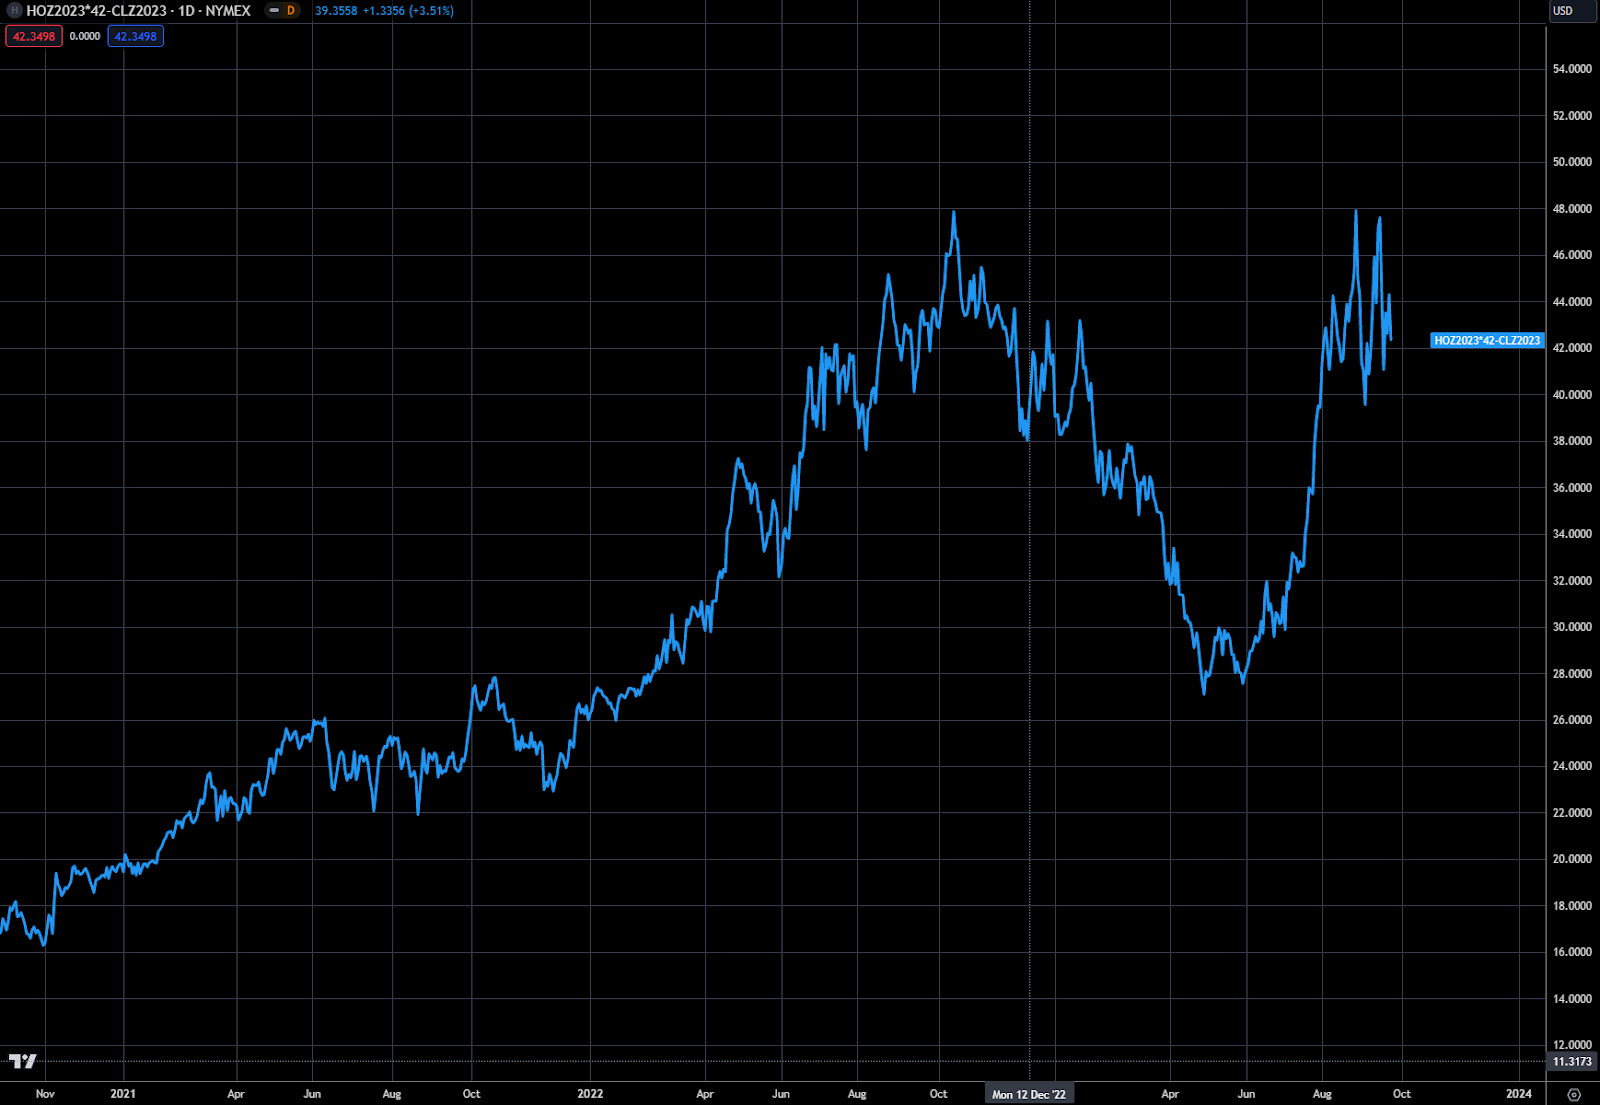
Where we are seeing crude oil spread divergence is shown in Chart 6, and this is where you will tend to see the divergence first when looking at forward curves. The Blue line is the December 2023-December 2024 contract and the orange line is the next year spread, December 2024-December 2025 spread. The two were running hand in hand, until just a few weeks ago. Both spreads were trading near $2.00 at the end of July, now the blue is trading over $10 and the orange near $5. This trading action is very typical of a market that the price of the underlying has gone vertical, which Crude Oil has. These explosive vertical moves tend to be short in nature, 1-3 months and then all the price shock news has been factored in.
Chart 6: Crude Oil futures spreads Dec 2023-2024 (Blue RHS) Dec 2024-2025 (Orange LHS)

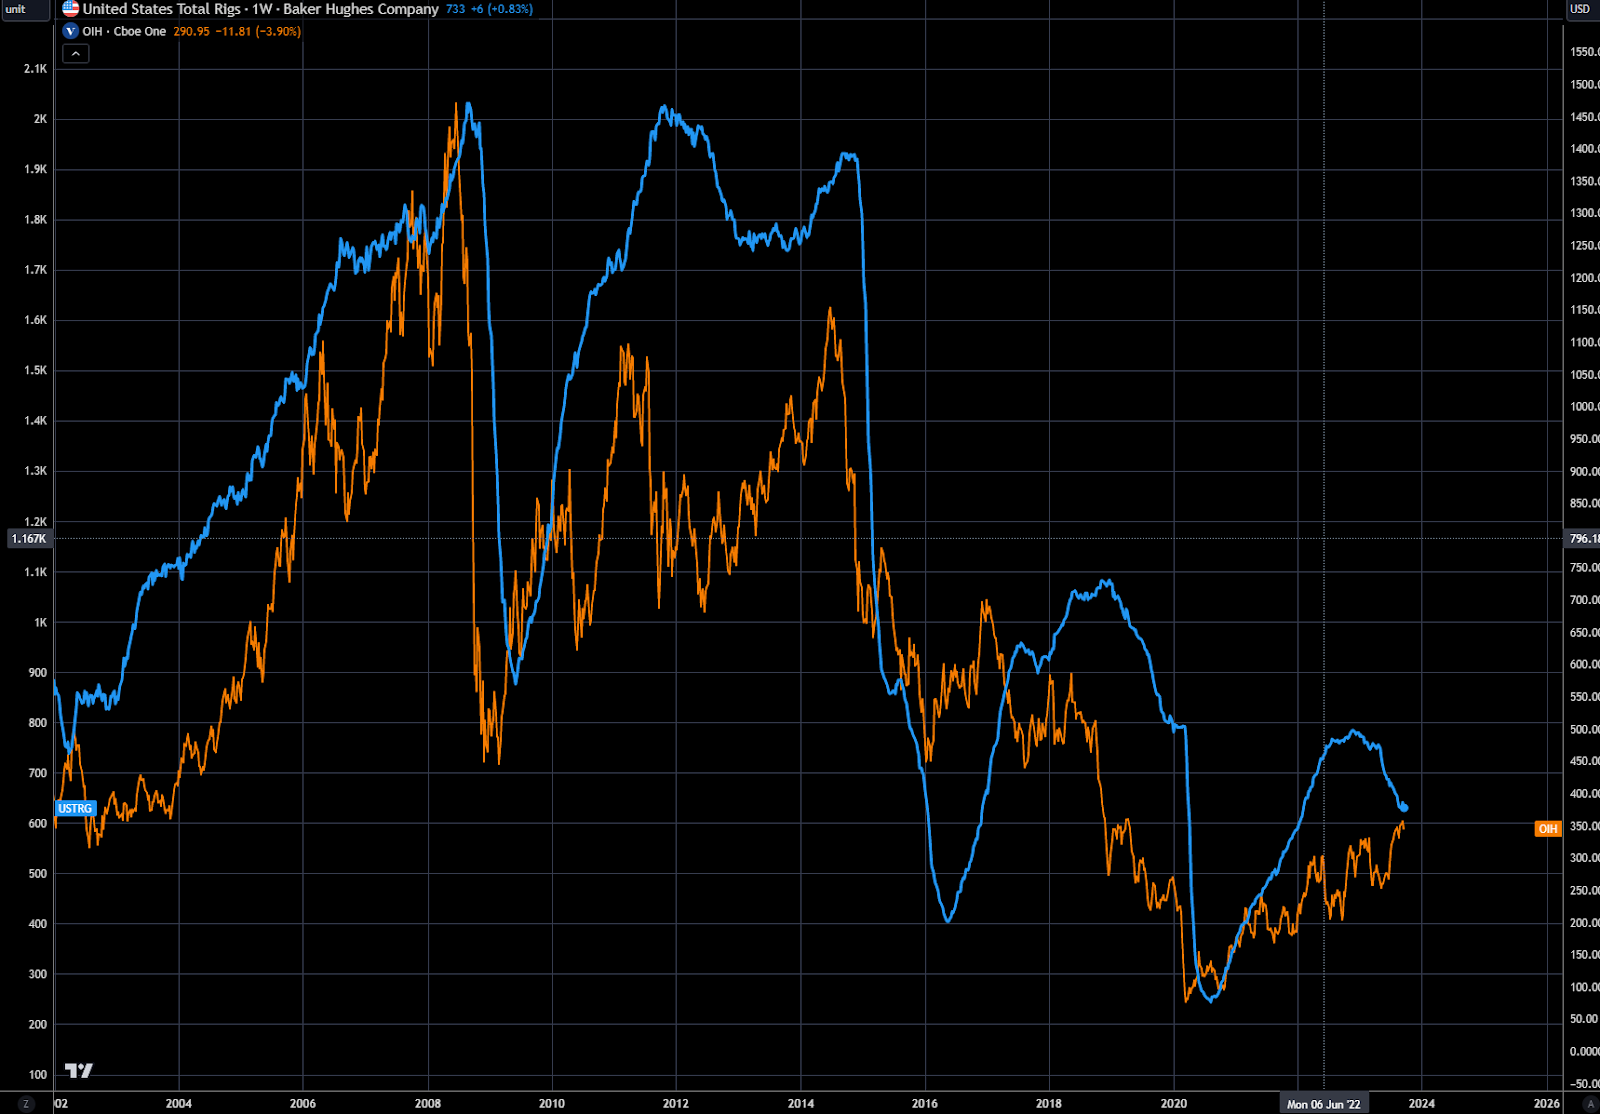
OIH is the VanEck Oil Services ETF, and is another great way to play the potential expansion in the oil drilling sector. Chart 7 is the price chart going back to 2012. We showed earlier that rig drilling activity peaked in 2014, which is also about where the price of OIH peaked. If we truly are in a long-term bull market for energy, OIH has a lot of ground to make up. Chart 8 shows the high correlation to rig counts in the Blue and OIH in the orange. With the global supply of oil getting tighter, and the need for more drilling in the US, OIH offers a great way to play this opportunity.
Chart 7: Crude Oil—OIH –Oil Services ETF
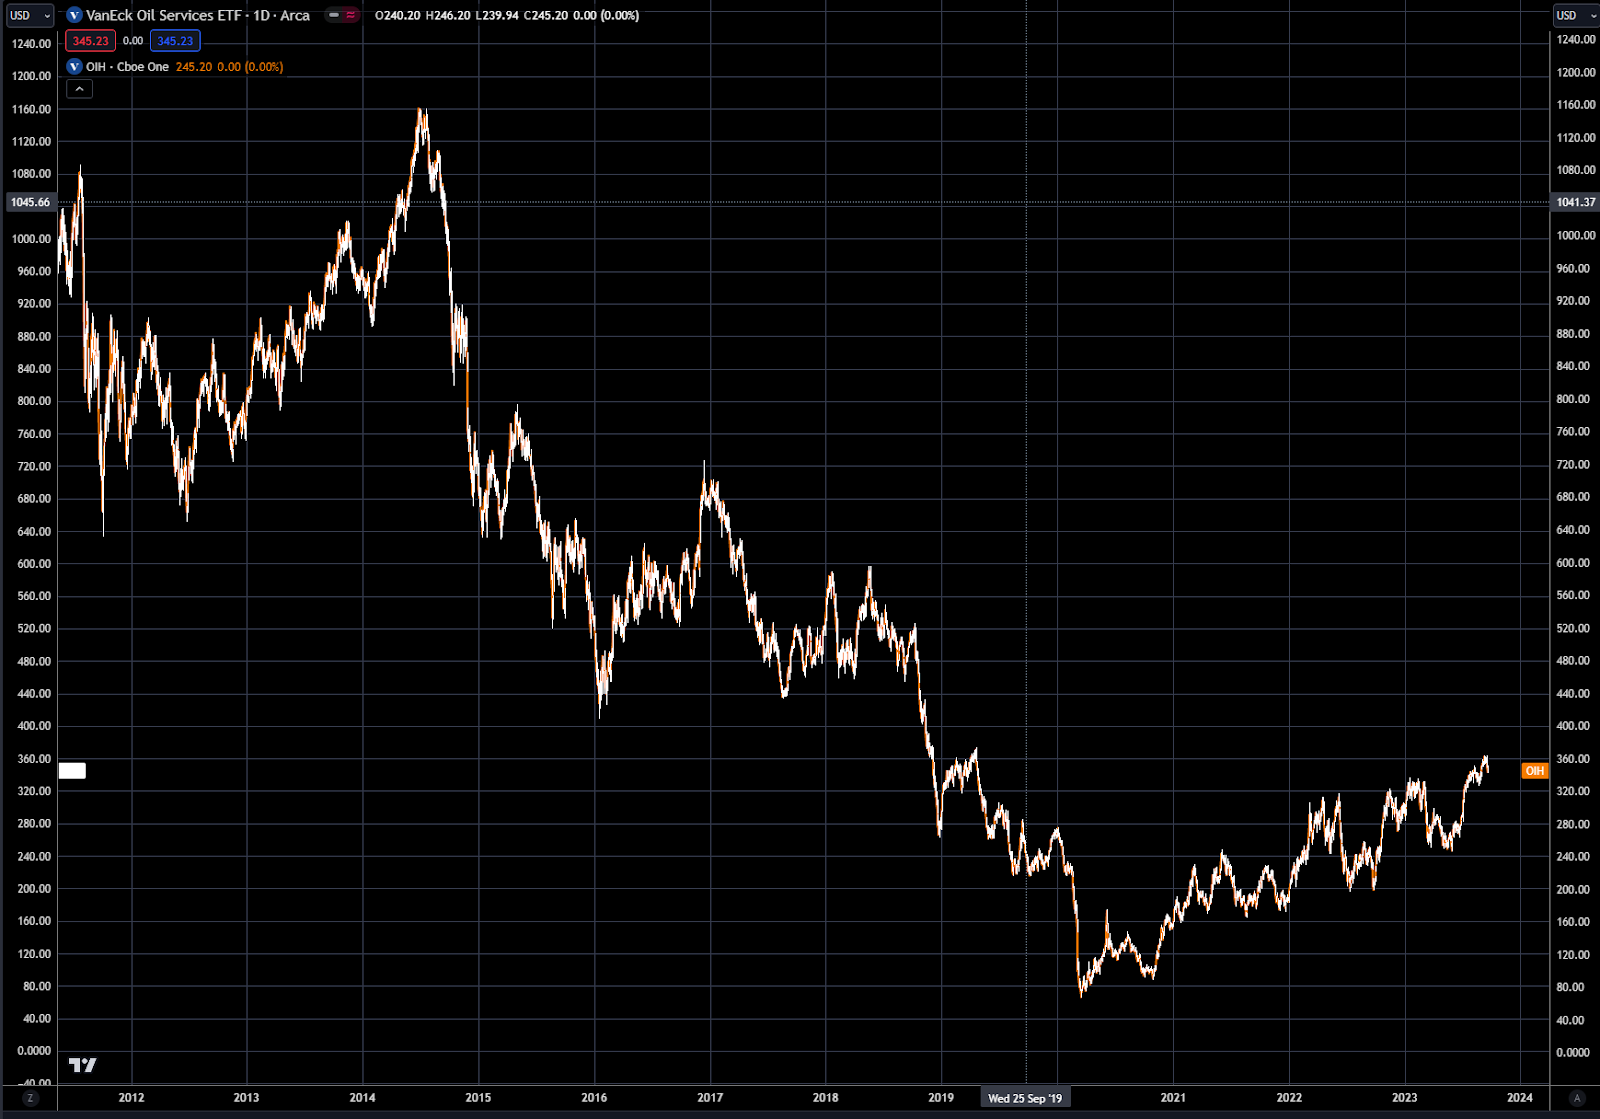
Chart 8: OIH (Orange RHS) and Baker Hughes Rig Counts (Blue LHS)
Appendix
Citibank is bearish Oil:

Source: https://oilprice.com/Latest-Energy-News/World-News/Citigroup-Says-To-Short-Oil-After-Summer-Is-Over.html
Long term picture is potential quite bearish?