Energy Falls, While Bond Vigilantes Return
Author: Bruce Liegel
It has been a very wild past few weeks in the markets as the froth of the bull market has reversed in a number of sectors. Some of this has been led by the large increase in “term premium” in the long end of the bond market, but in reality, especially in energy, the market got way ahead of the fundamentals.
The distillate market sold off after Russia reversed its export ban, and the gasoline market collapsed after demand declined dramatically in the most recent EIA report. We pointed to a number of divergences in the energy market in our most recent deep dive, which gave us warning signs the bull market was nearing its end on a short-term basis.
The fudge factor “term premium” was once again brought to front and center in the bond market to explain the rise in long term yields. This definition by all measures is the term used by economists when they have an unexplained variable in their models. Hence the term ‘Fudge Number”.
Gold and silver finally rolled over with the increase in the term premium enough to push both over the edge and through market support levels. As outlined in our gold report, the expected decline is now nearing support levels, but the strong non-farm employment number on Friday, will likely keep the pressure on higher rates for the foreseeable future.
The interest rate market in the US is now nearing our long- term targets of 4.75-5% in the 10 and 30- year. We feel the acceleration phase is getting mature in the long-end of the curve, but the market is not giving us a signal that the end is near yet. This surge in US rates is also giving a bid to the USD, with the DXY rally now in its 7th week — after it held the import 100 technical level in July.
Equity markets have turned over with the expected correction outlined numerous times over the past few months. The question is are we getting close to the end of this correction, and what is now driving the lower valuations in equity prices. It appears the market's unexpected rise in long-term yields is impacting equity valuations, finally. Equities have been ignoring the rise in rates, expecting the Fed to begin its easing cycle at any time, but now with the resurgence of the bond vigilantes, a new risk factor has now been introduced to the market. Many have been wondering when these market outcasts would once again merit a voice at the big table — that time has now come.
Chart 1 below shows our preferred DXY forecast that has been in play for most of the year. As mentioned earlier, the key 100 level held in July, setting up the final leg V of this bull market which began in 2008. The DXY has rallied for 7 straight weeks, so a pull-back should be expected, but the target for new highs is still in the cards. Dollar Yen approached 150 this week and whether there was intervention by the MOF or not, the market did see an increase in market volatility this week. I do believe the 150 is a line in the sand for the MOF and the BOJ. The 150 level has been the high in JPY for over 25 years. See chart 2
The Euro is also digging into support near the 105 level — further arguing the DXY index is due for a correction. The 50% Fibonacci level is also just below 1.05, giving added support (see chart 3).
Chart 1: DXY Index

Chart 2: JPY—Japanese Yen

Chart 3: Euro FX

The long end of the rate market exploded higher over the past few weeks, and the long end of the curve has now reached out targets presented a few months ago. Chart 4 shows the preferred path for the 30-yr with upside targets met, but with a parabolic move in progress, we should expect an overshoot in the short term. At this juncture watch for a reversal day / week to signal potential topping action taking place.
Chart 5 shows the US 10-yr, which has been mirroring the 30-yr for the past few weeks and has surpassed our original targets. But like the 30-yr, the trend is now parabolic, and needs to run its course.
In Chart 6, the SOFR rate for Dec 2025 is shown. The SOFR is the short- term overnight financing rate used by the market to build forward curves — and what drives swap rates. THE SOFR replaced the Eurodollar market. The price action is beginning to dig in near the 95.80 level (4.2%), an early sign that the rise in rates is nearing an end. I’m watching this as an early indicator that the market is turning.
Chart 4: US 30-yr

Chart 5: US 10-yr
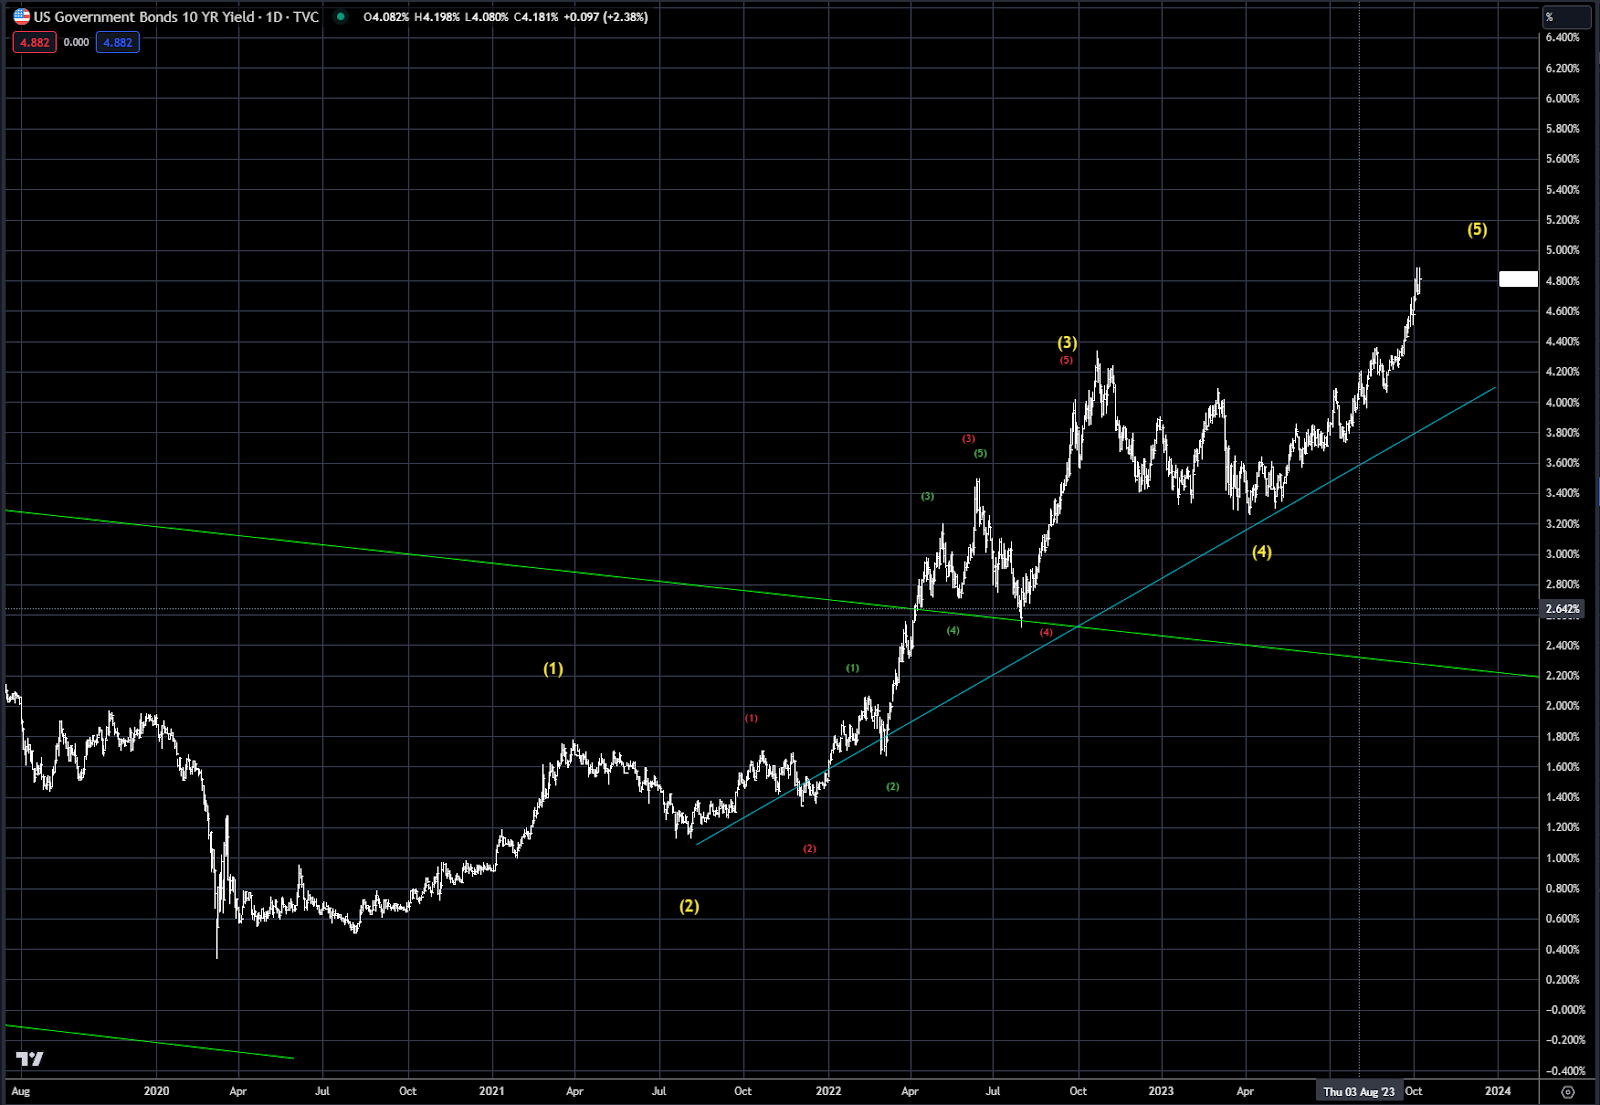
Chart 6: SOFR Dec 2025 Futures

Chart 7 shows the gold chart that has been presented over the past few months, with the price decline now finding support around the $1800 level. Friday’s reversal in the face of higher rates is short term positive, and we should expect a bounce higher next week. The market probably needs more time to build a base, so a retest of the $1800 level should be expected in a few weeks after the corrective rally has run its course.
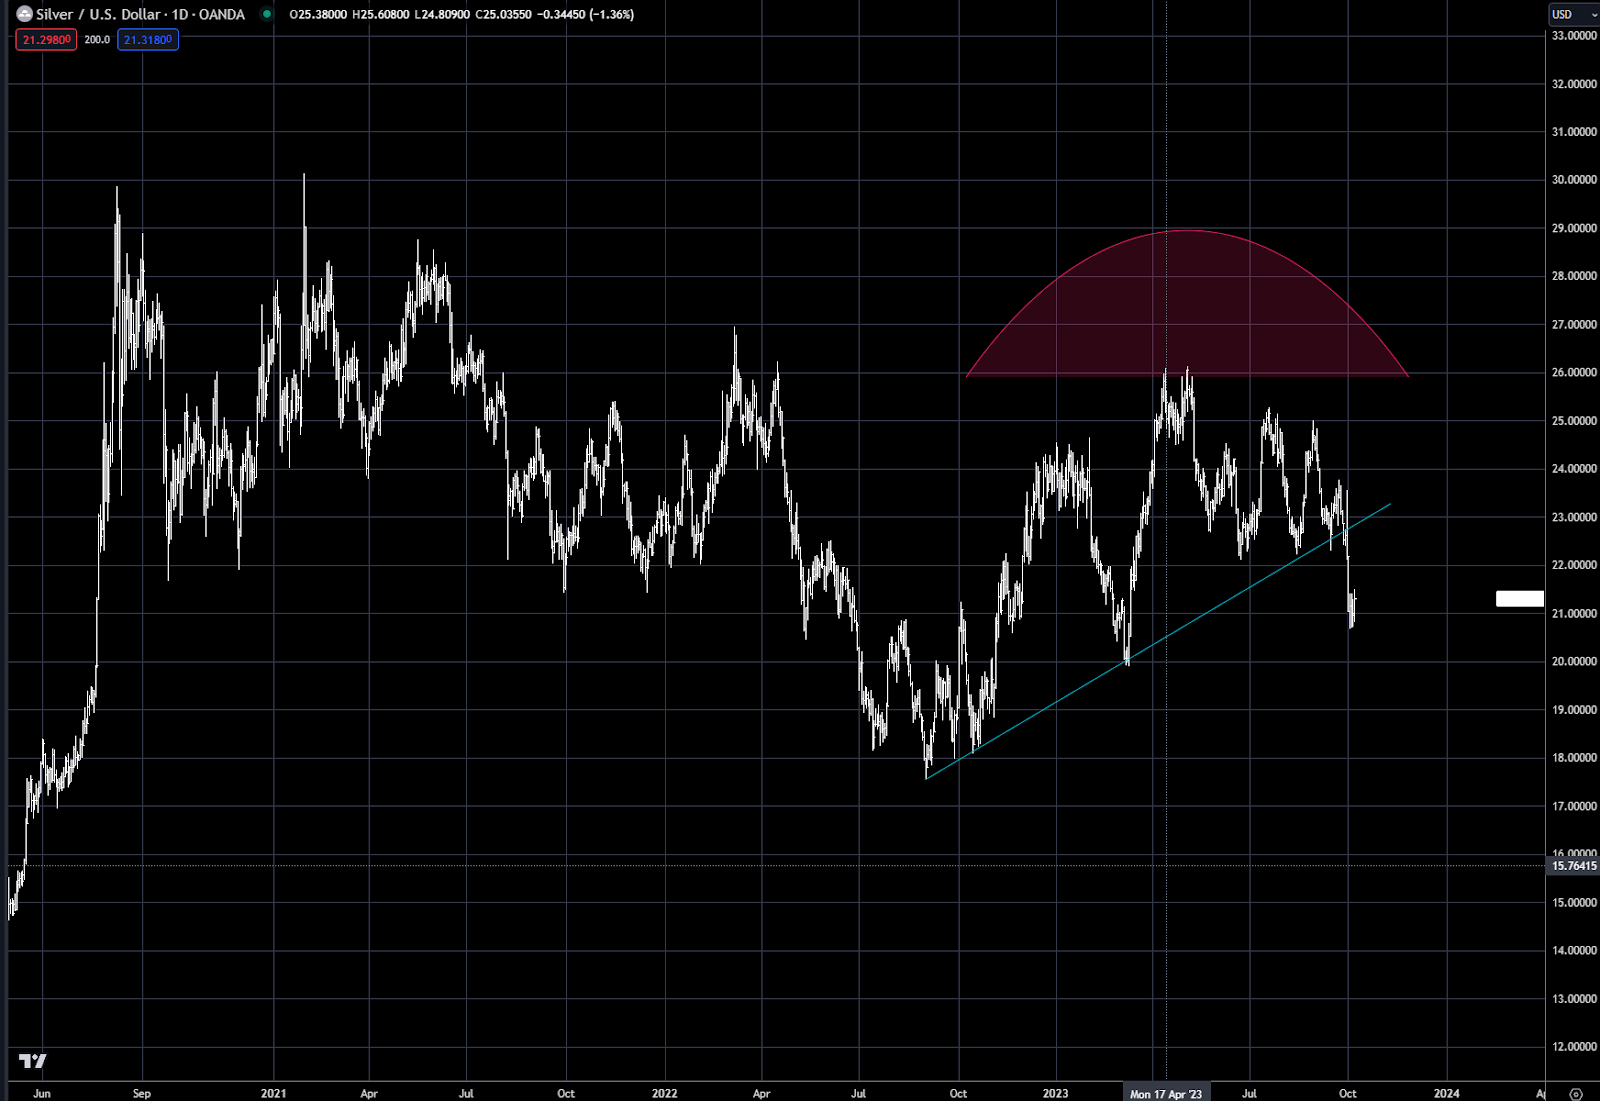
Silver is also in a similar position, with the market finding support near $21.00, but after a price bounce, the $20.00 target is still in play to the downside.
Chart 7 XAU Gold

Chart 8 Silver
Oil prices fell sharply this week, with crude oil dropping over $10 from the highs. As outlined previously, Chart 9 below shows the outlined path from our Oil deep dive a few weeks ago. The best support is now just above $80.00 which is the old highs, and the 50% Fib retracement area near $81.00. Although the sharp decline looks quite ominous, the expectations are still for much higher prices over the next 2-3 months – approaching the $100 level.
Product prices also collapsed this week with gasoline dropping almost 50 cents from the highs and Distillates falling over 40 cents. We discussed the divergence in product markets in our deep dive, as they were warning that a correction was imminent.
The drop this week should be viewed as a VERY healthy correction, which removed a lot of the froth from the market.
Chart 9: Crude Oil November NYMEX Futures

Chart 10: November Gasoline (Blue) December Ultra Low Sulfer Distillate ( Orange)

Global stock markets appear to be close to ending the correction since July. Chart 11 shows the SPX index, and the pullback to the key support at 4200 was tested and held this week and the trendline from the Cot 2022 low also held. Both are very encouraging.
On the bigger picture, the rally that is about to start should end the bear market rally from the 3500 lows. This timing is a few weeks or months away, so there is time to focus on this later—for now focus on the short term move to the upside.
The Nasdaq decline was quite shallow, with the decline less than 10% from the summer highs. The market has been digging in near the 14,400 level now for a week or two, and appears to be setting up for a move higher (see Chart 12).
The Japanese Nikkei continues to grind higher inside the Channel that has been ongoing since the 2012 low (see chart 13). The all- times highs are marked by the horizontal blue line just below 40,000. The Japanese markets continue to be a buy on pullbacks.
Chart 11: SPX SP500 Index

Chart 12: Nasdaq

Chart 13: Nikkei

Trading strategy is based on the author's views and analysis as of the date of first publication. From time to time the author's views may change due to new information or evolving market conditions. Any major updates to the author's views will be published separately in the author's weekly commentary or a new deep dive.
This content is for educational purposes only and is NOT financial advice. Before acting on any information you must consult with your financial advisor.