This Week in Global Macro (August 7)
Data takes center stage, Fitch downgrades, and market leaders begin to falter.
It was another week of important data, with the BOE hiking by 25bps, and the ISM and NFP reports in the US both weaker than expected. With all central banks indicating data dependency in their monetary policy decisions, it seems each week is full of relevant data.
This week we see CPI and PPI data released, which will either confirm the continued deflationary trends or we will begin to see the year-over-year effects mentioned in prior reports. The YOY effects are due to the 2022 CPI index flatlining in the second half of 2022.
The other news story that moved markets was the Fitch downgrade on for the US – never mind that Moody’s and S&P had already done this years ago. Nonetheless, it moved markets with a good correction after the announcement. Apple’s quarterly miss also added to the downside story on Friday.
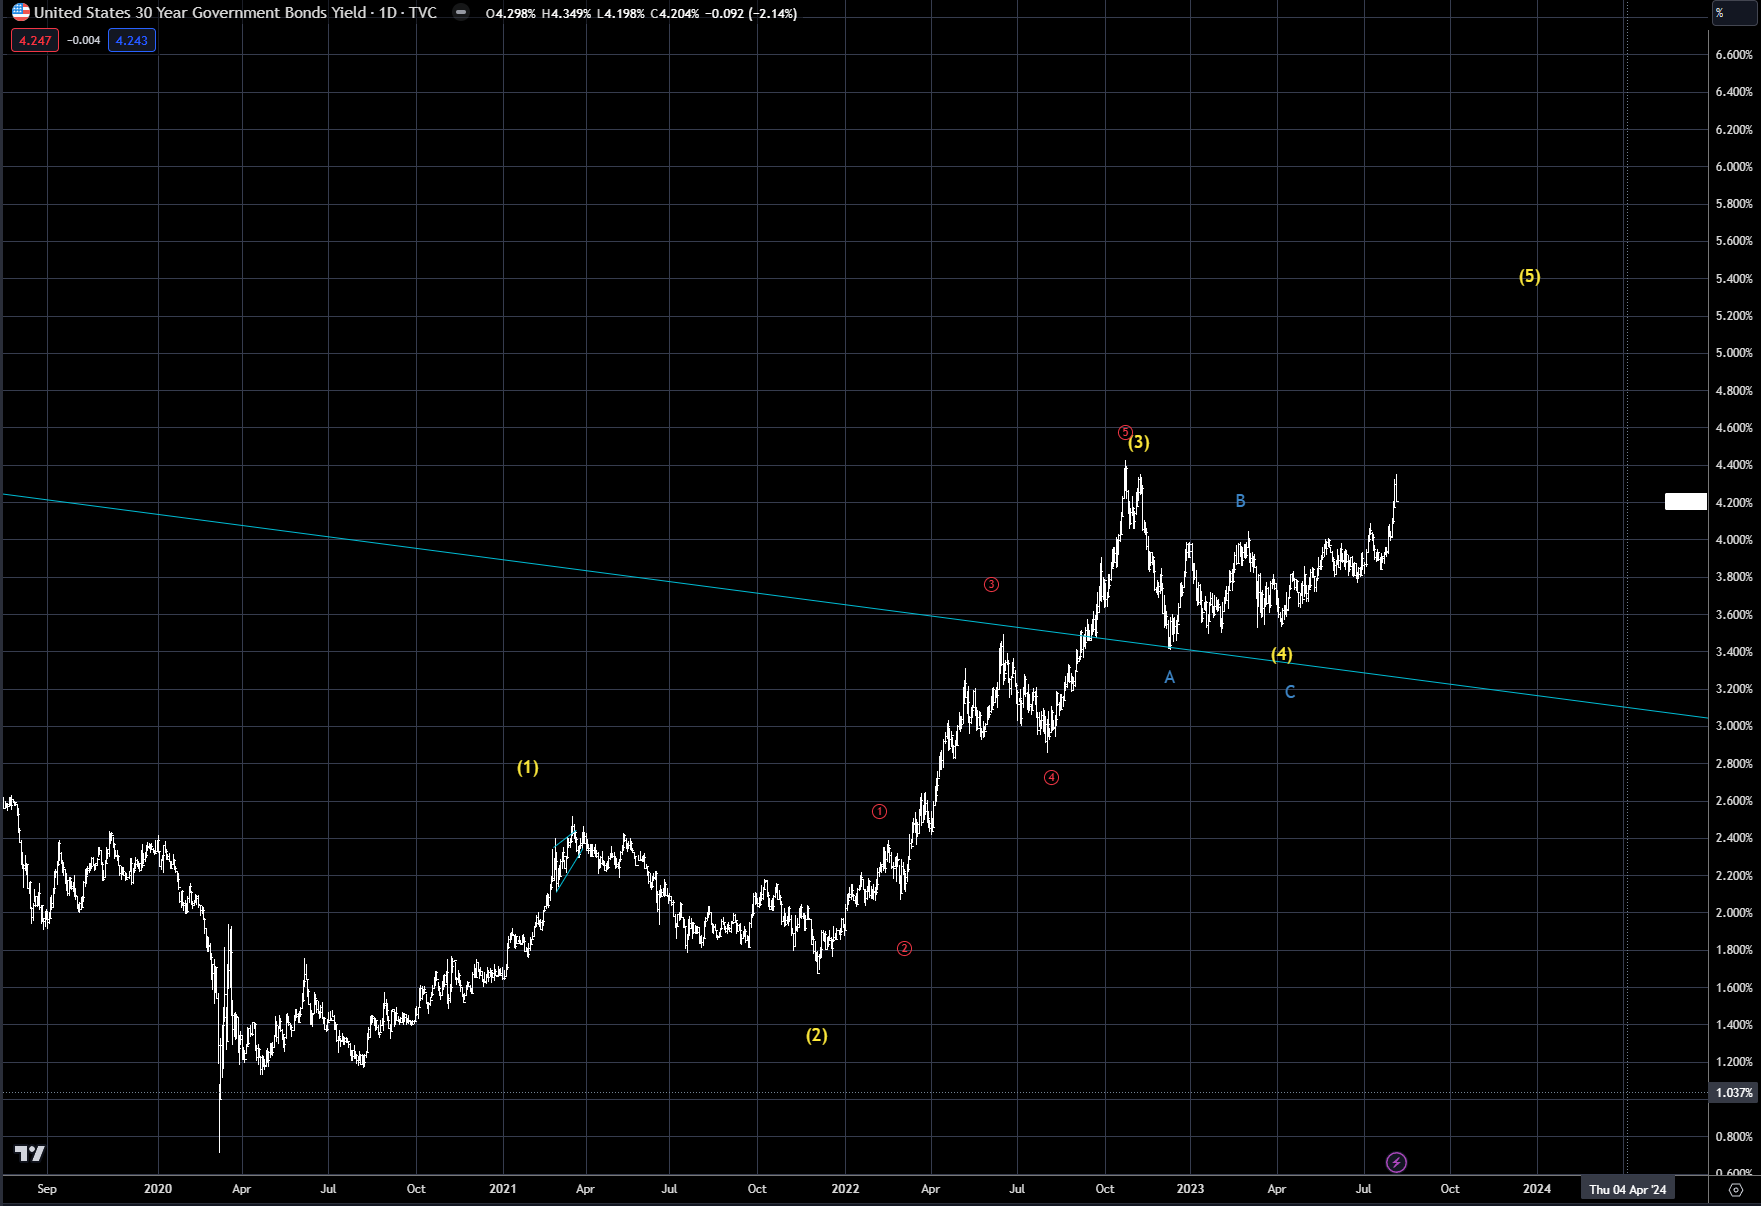
If you have been following us for the past few months, we have been arguing for a higher move in the long end of the curve. The catalyst is always tough to predict, but the Fitch announcement spurred the US long end to move higher on Thursday, making new highs for the year for both the 10-year and 30-year. See charts 1 and 2.
Both markets did see a reversal back lower on Friday, which will need to be monitored this coming week for potential upside failure. But for now, the trend still looks higher in the US and also other global interest-rate markets, as outlined last week.
Chart 1: US 10-year
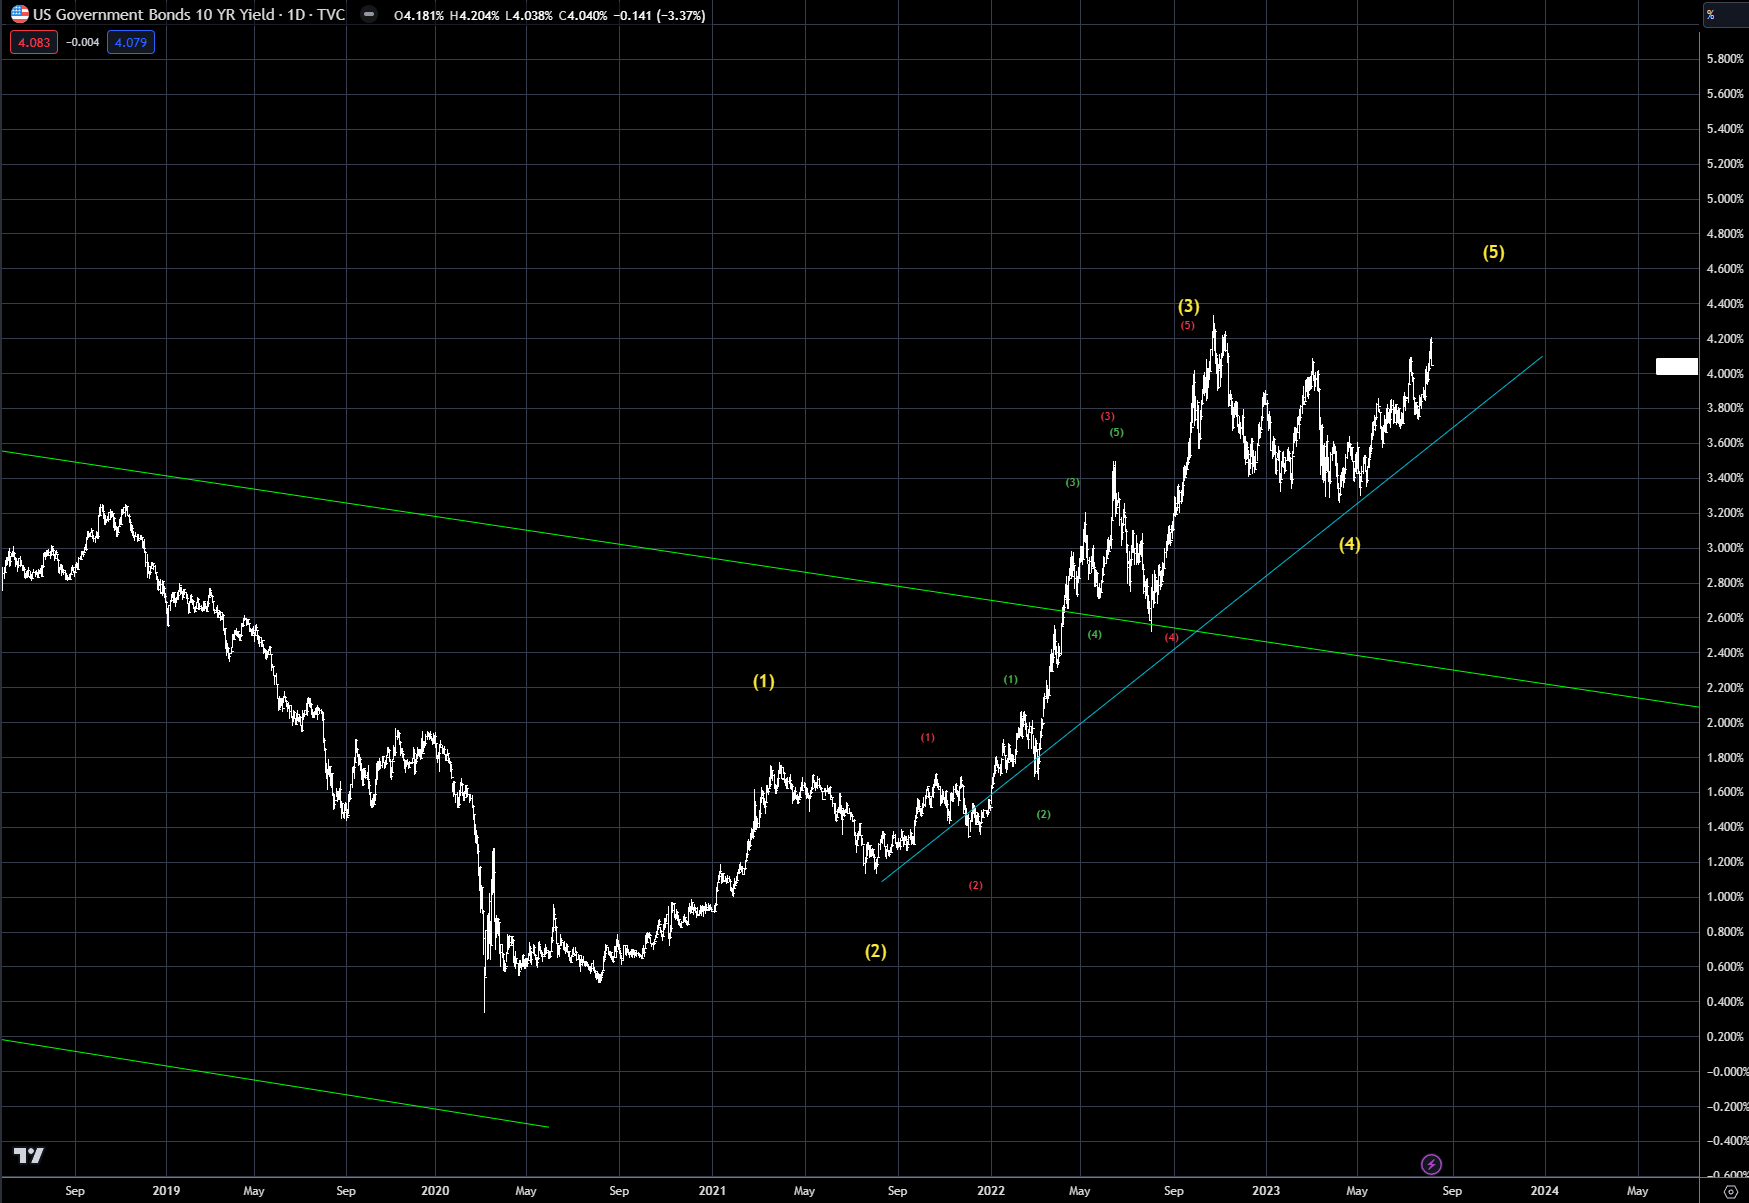
Chart 2: US 30-year
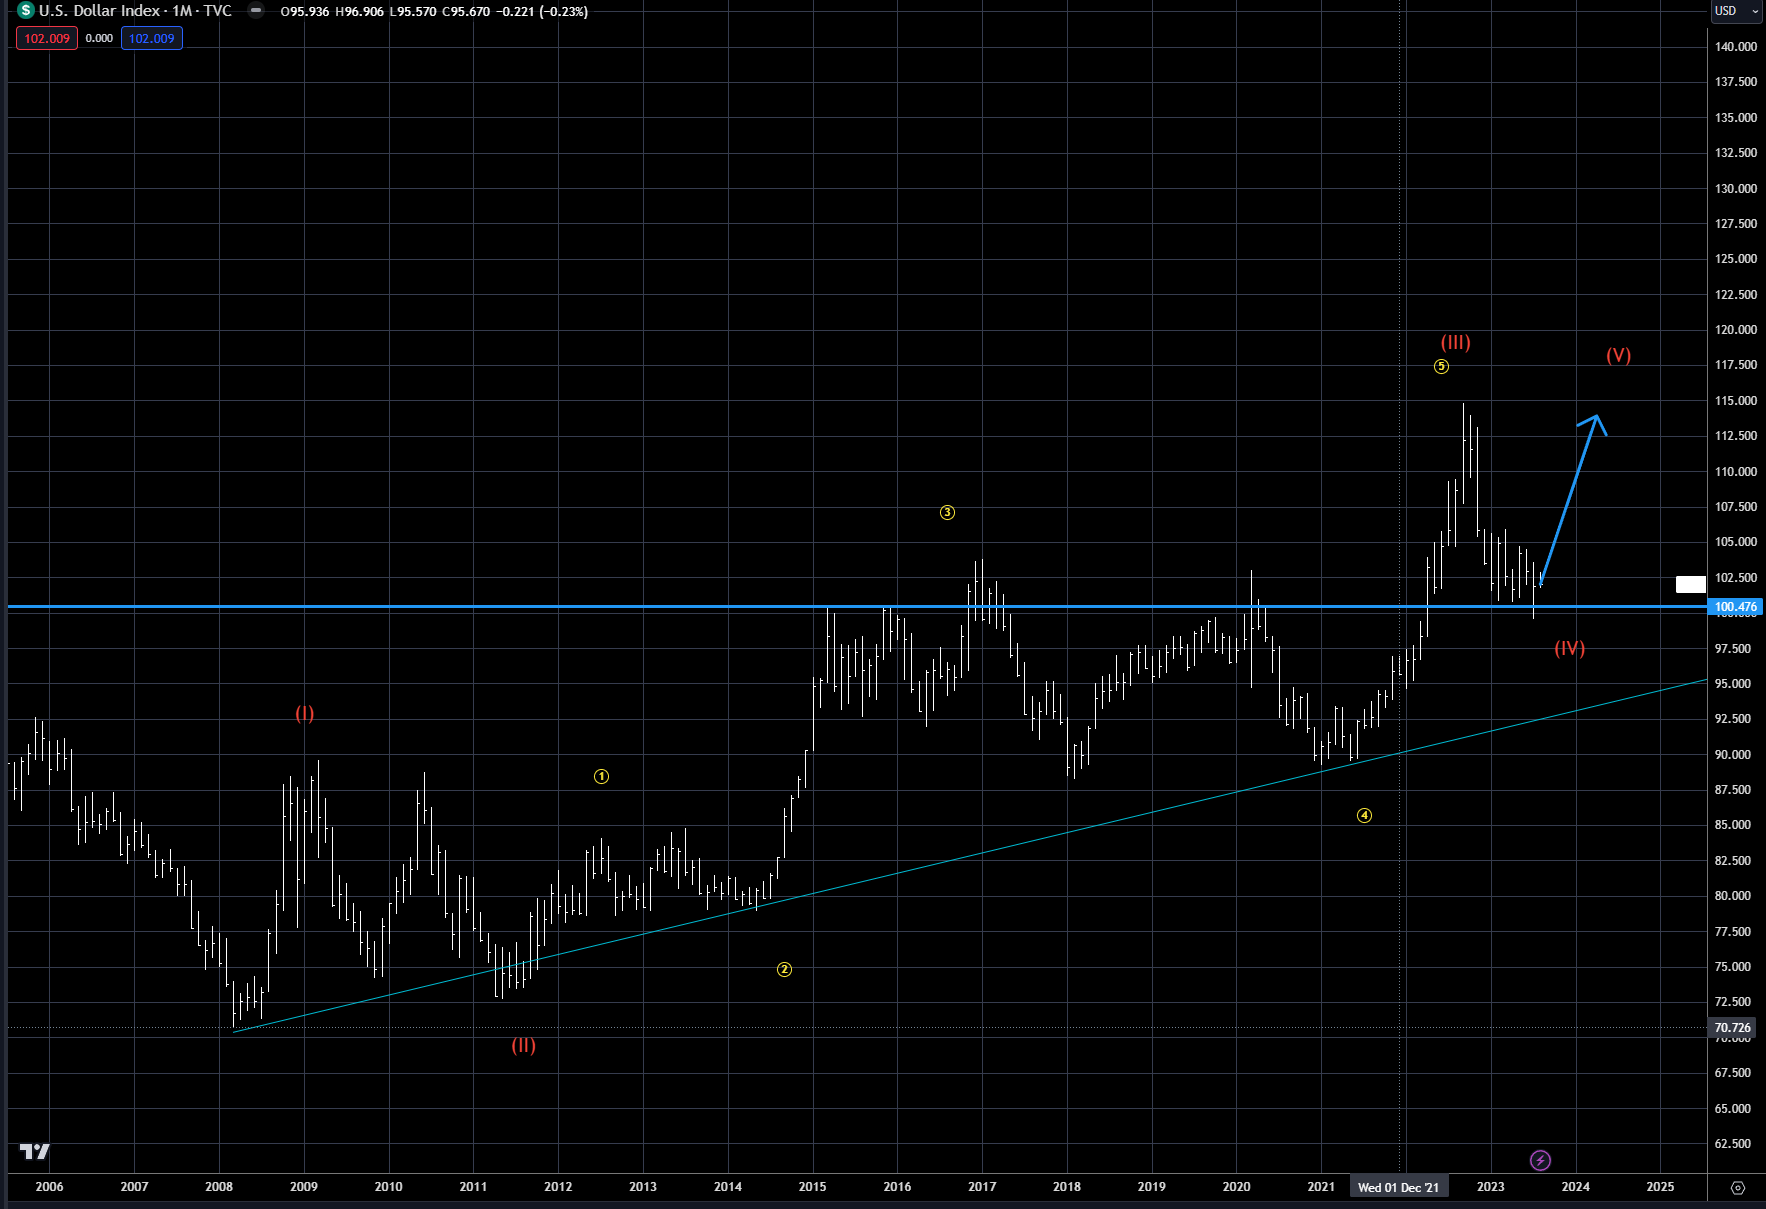
Last week’s global data was construed as dollar-friendly (downgrade is bullish?), as the DXY held the critical 100 level, as outlined in previous updates. The old highs over the past 10 years now act as good support, and a good rally should be expected for the balance of 2023. There may be more base building over the next few weeks, but the 100 level should allow for bottom development. Chart 3 shows the forecasted price path, as outlined over the past few months.
Yield differentials, or central bank monetary policy, will be the main driver as usual, but remember the DXY is always the beneficiary of risk-off trades. With the Russia and Ukraine conflict escalating over the last few days, this could be an exogenous event that is very supportive to the dollar and especially negative for European currencies.
Chart 3: DXY index
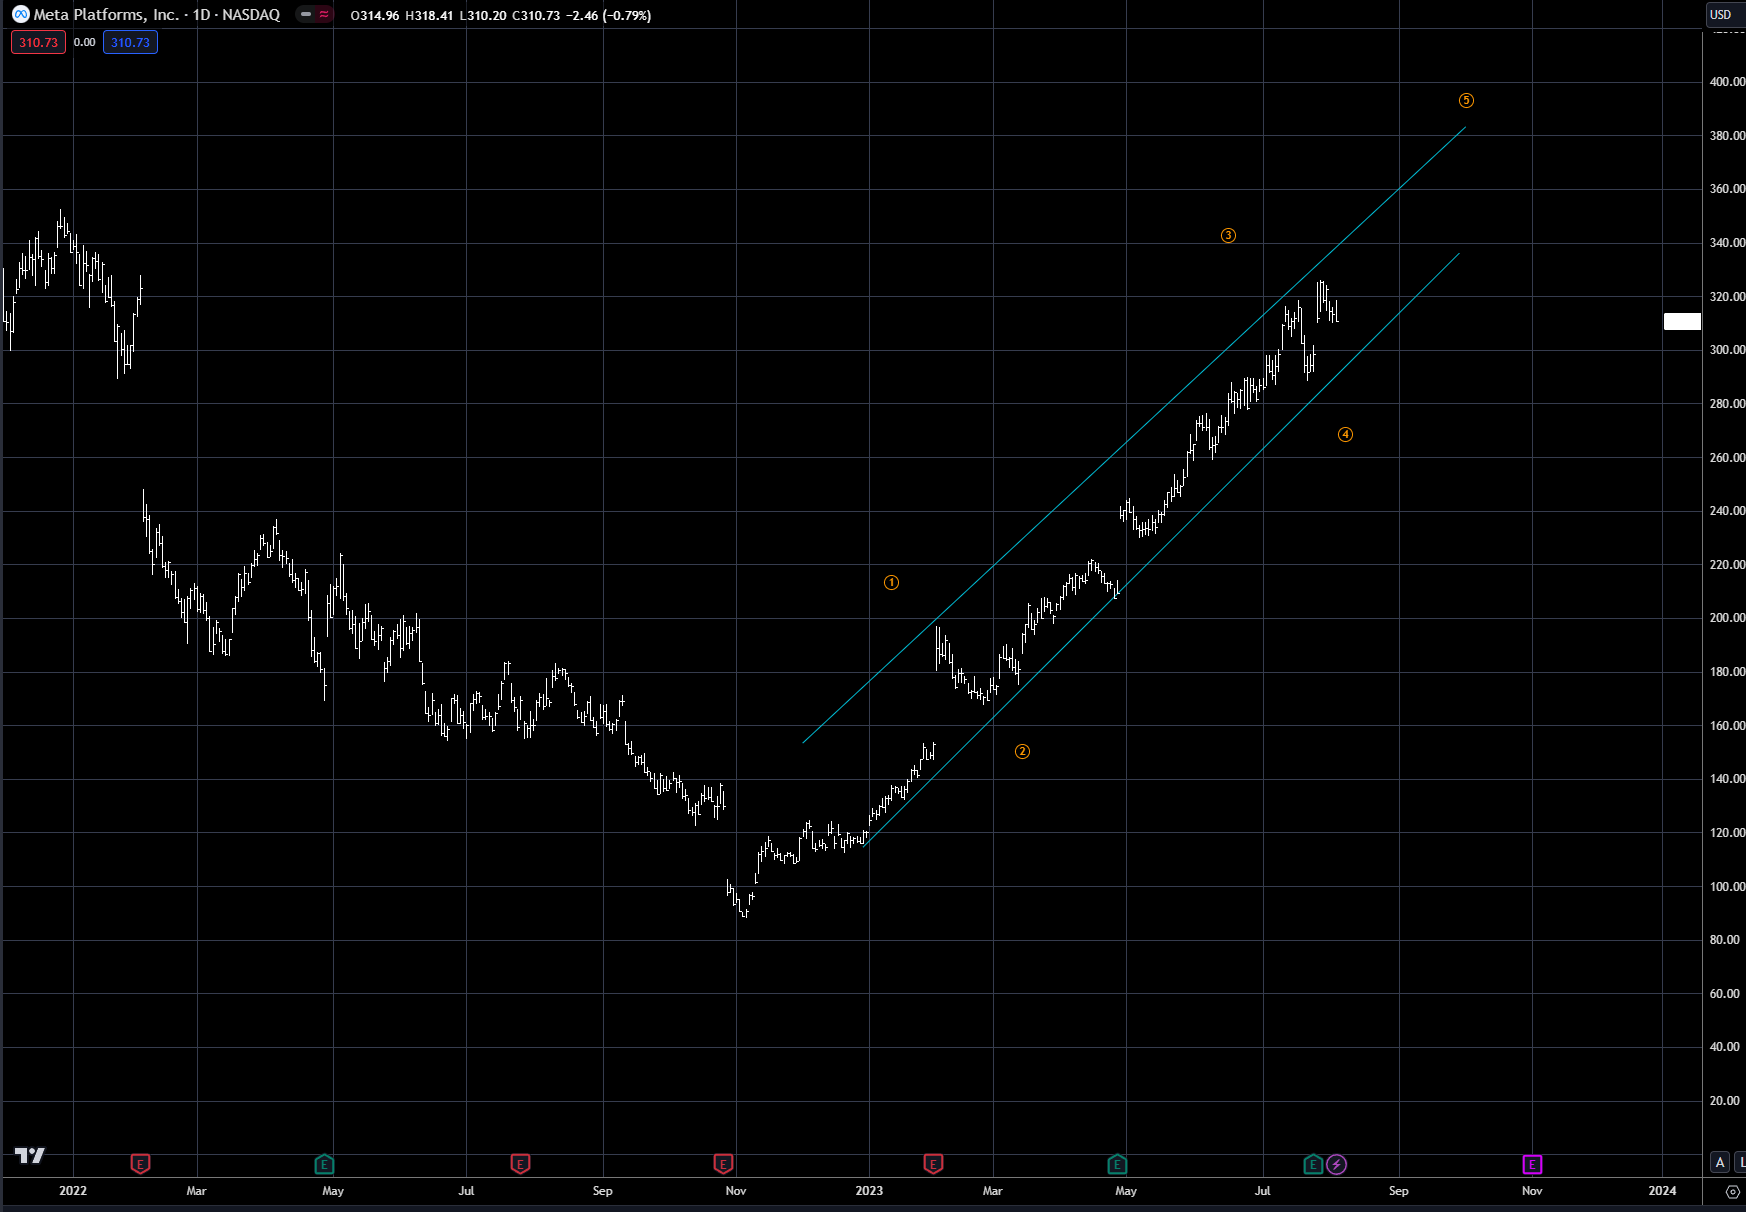
The wave 4 correction, as outlined a few weeks ago in equities, began last week with the Fitch downgrade, and accelerated with the Apple earnings release. Chart 4 below shows the price action for Apple and reveals the breakdown from the channel pattern that was discussed previously. Meta has not broken down yet, but Microsoft has, and one by one the market leaders are beginning to falter.
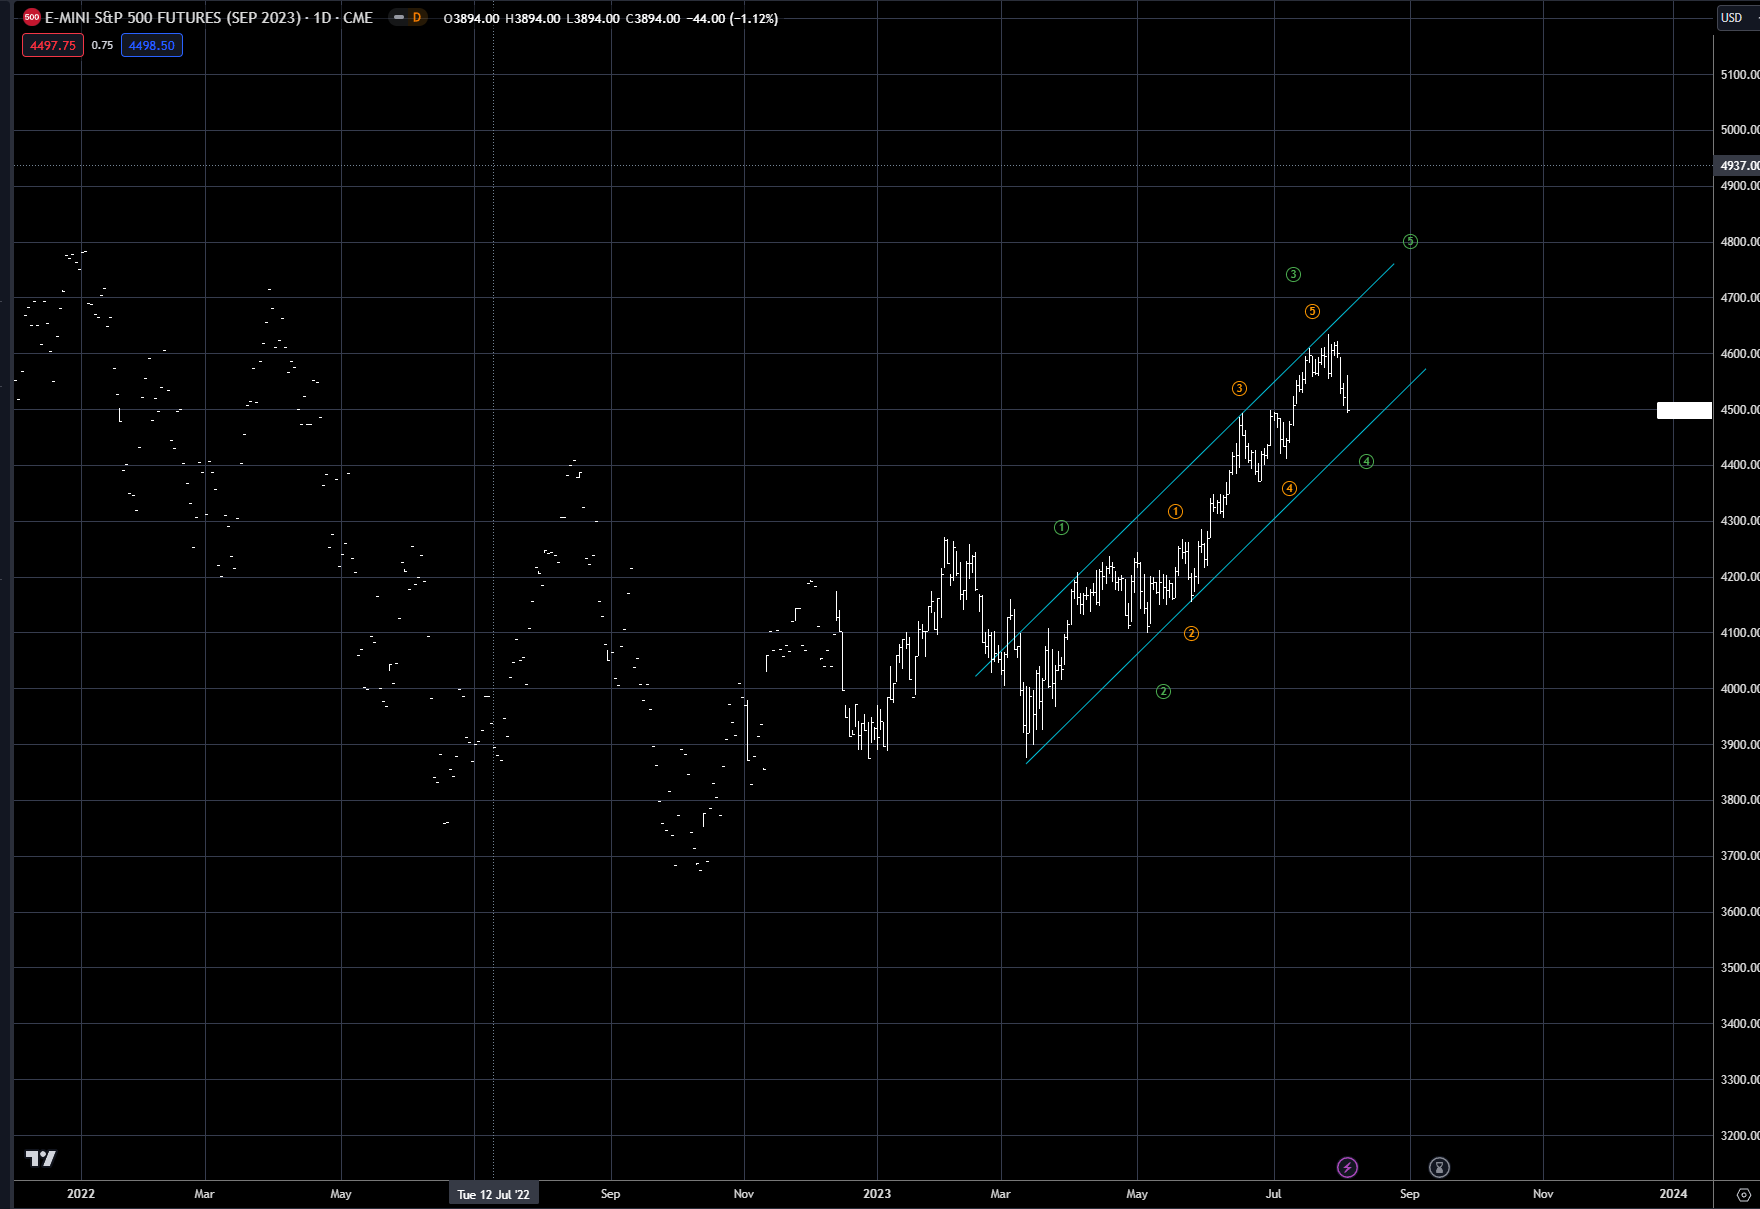
The overall Nasdaq and S&P 500 markets continue to hold inside the channel, as shown in charts 5 and 6, but both support lines could be pressured this coming week. Wave 4 corrections after breaking the channel support can get very ugly, as shown in Apple from chart 4. It looks like the wave 4 correction is just getting started, and could last a few weeks, so patience is important. The final move higher is still in play, but the correction must play out first.
Chart 4: Apple
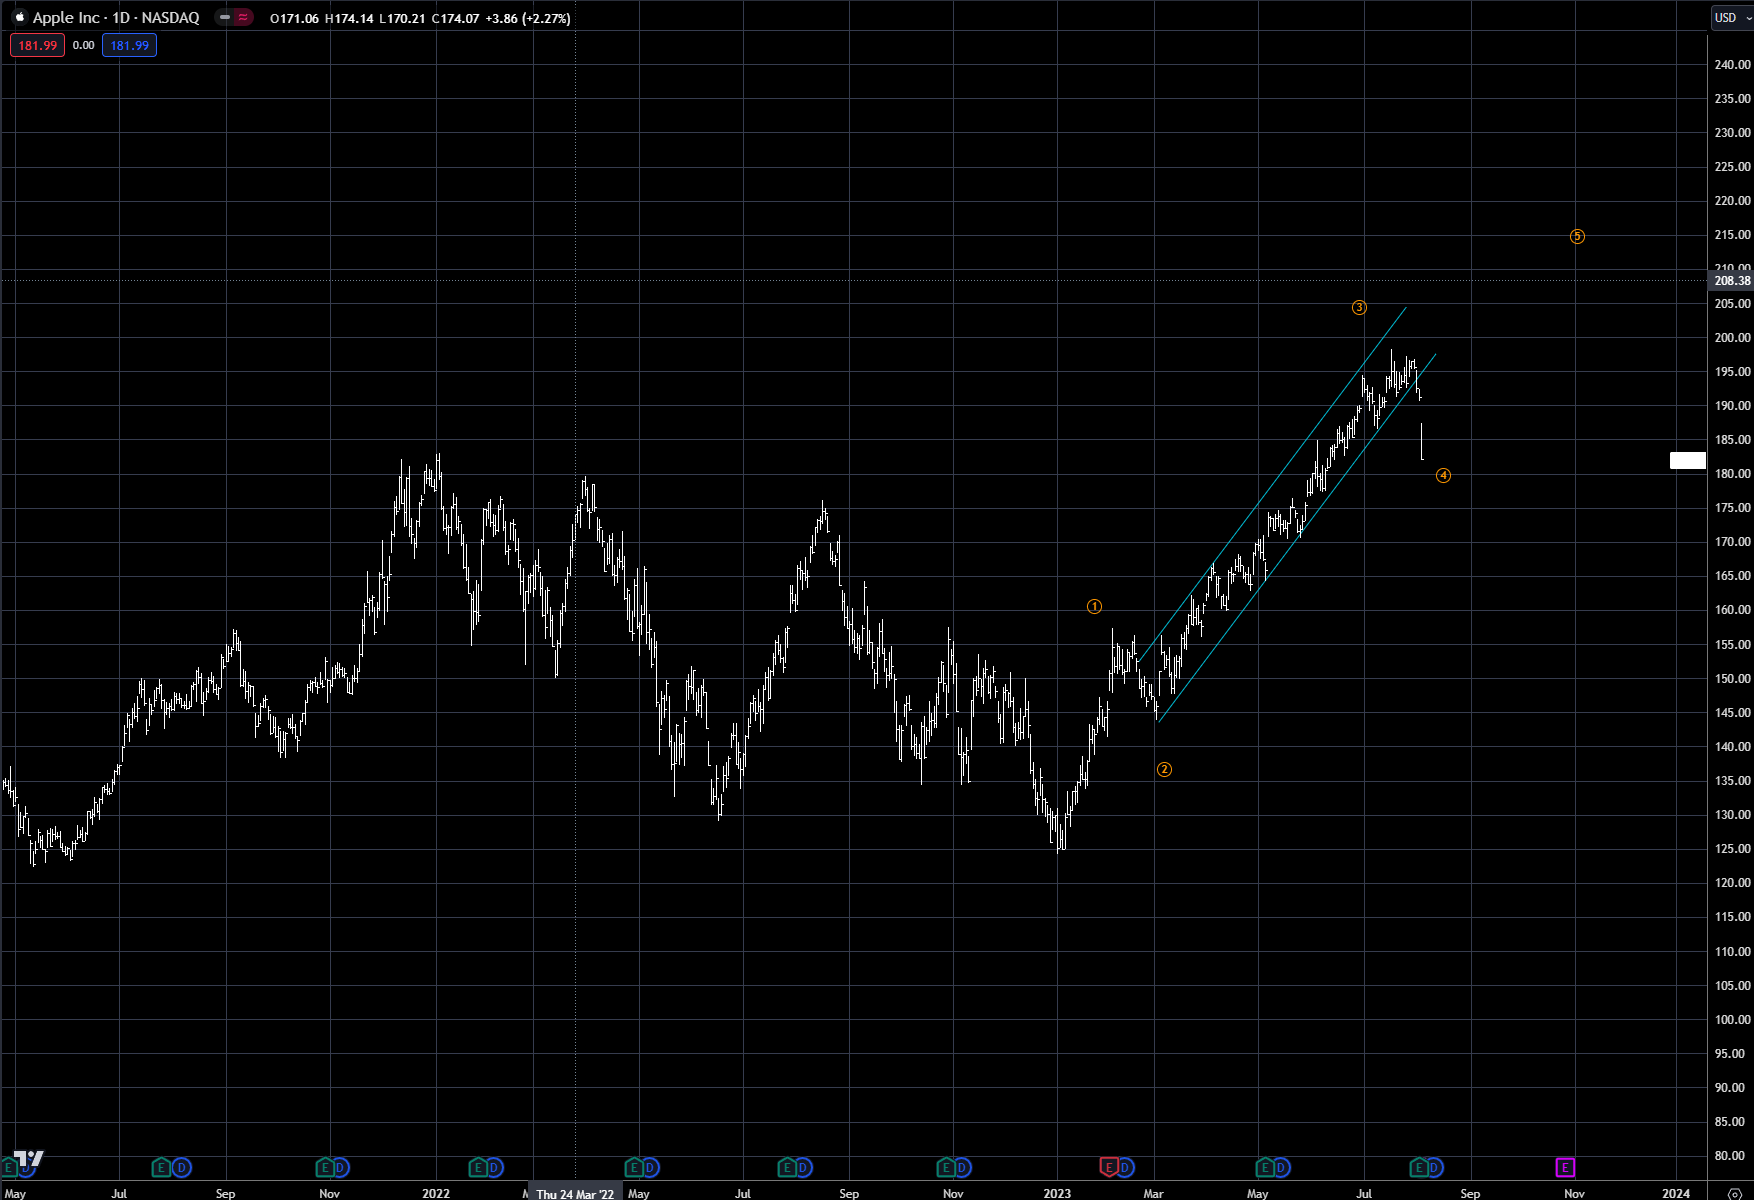
Chart 5: Nasdaq
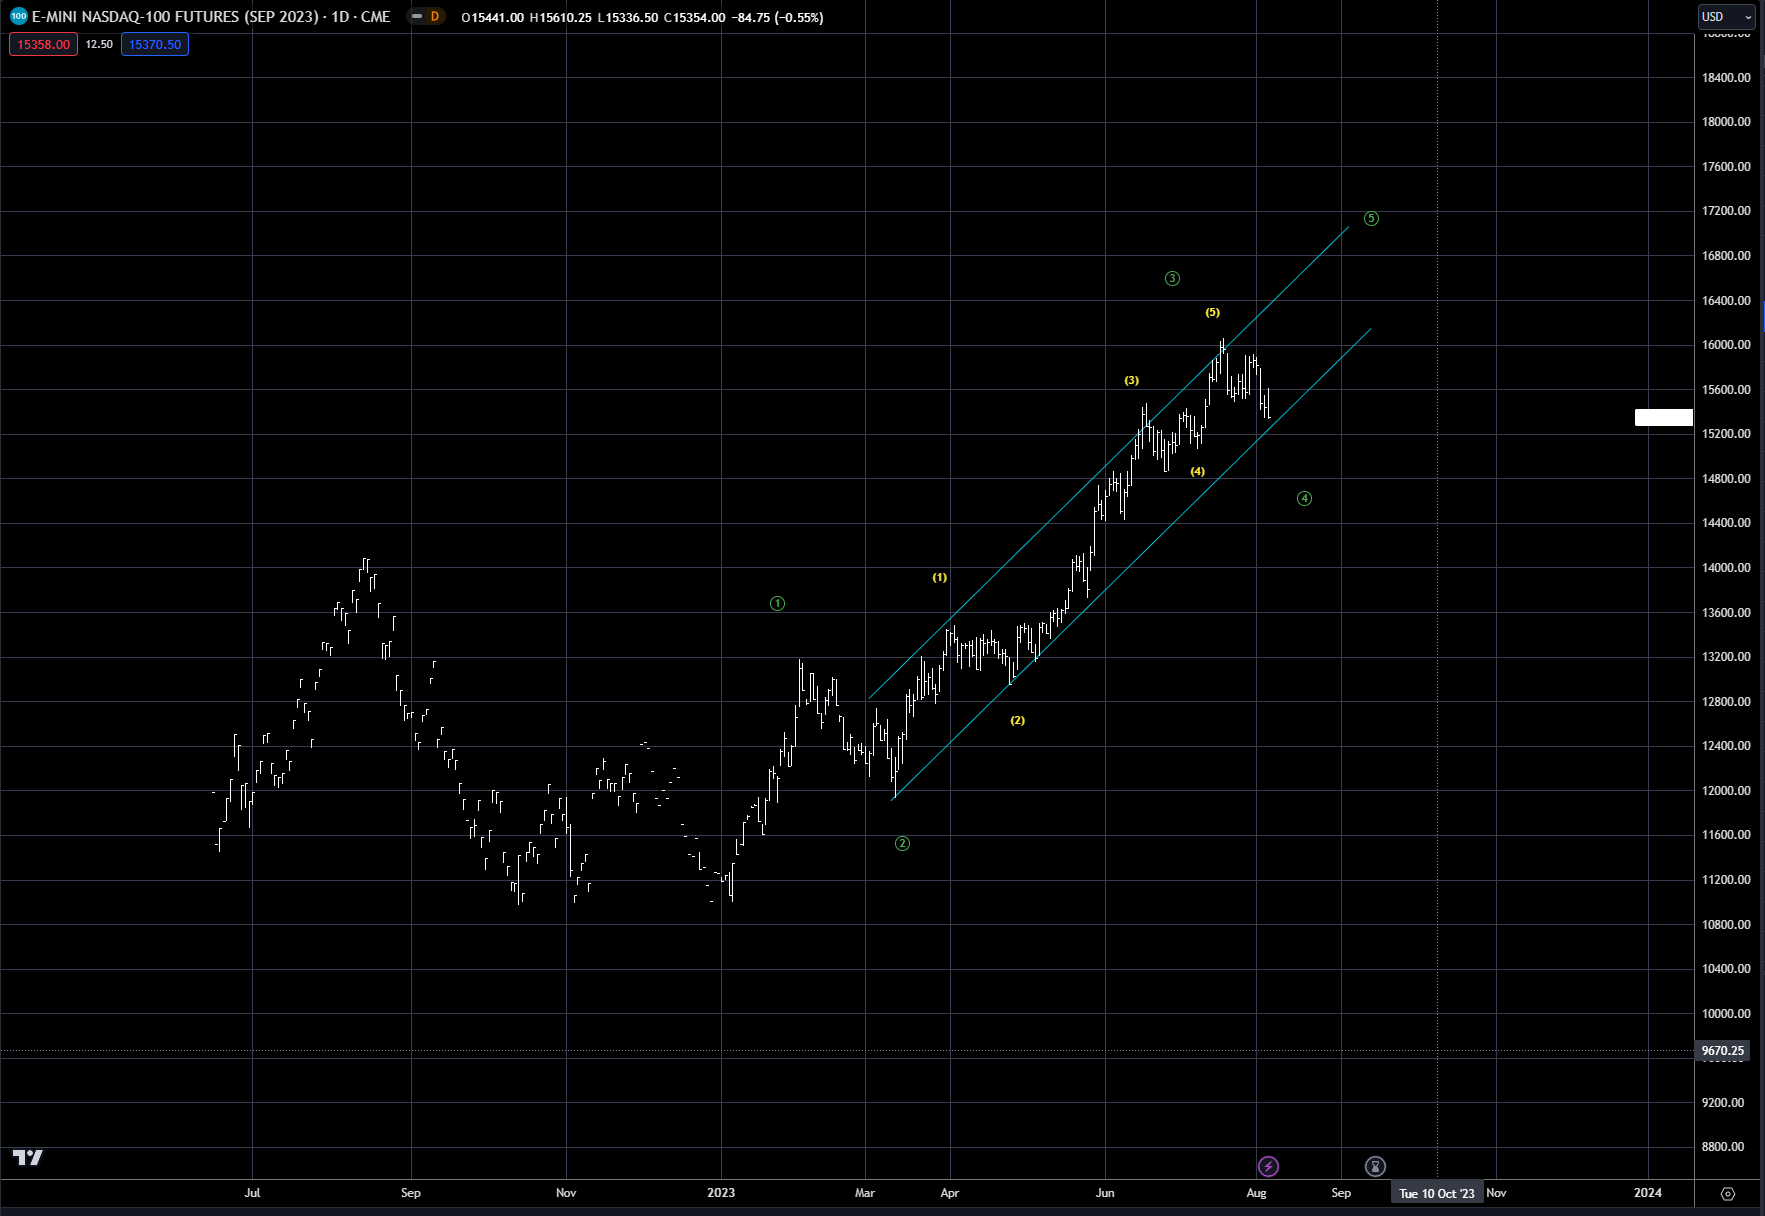
Chart 6: S&P 500 index
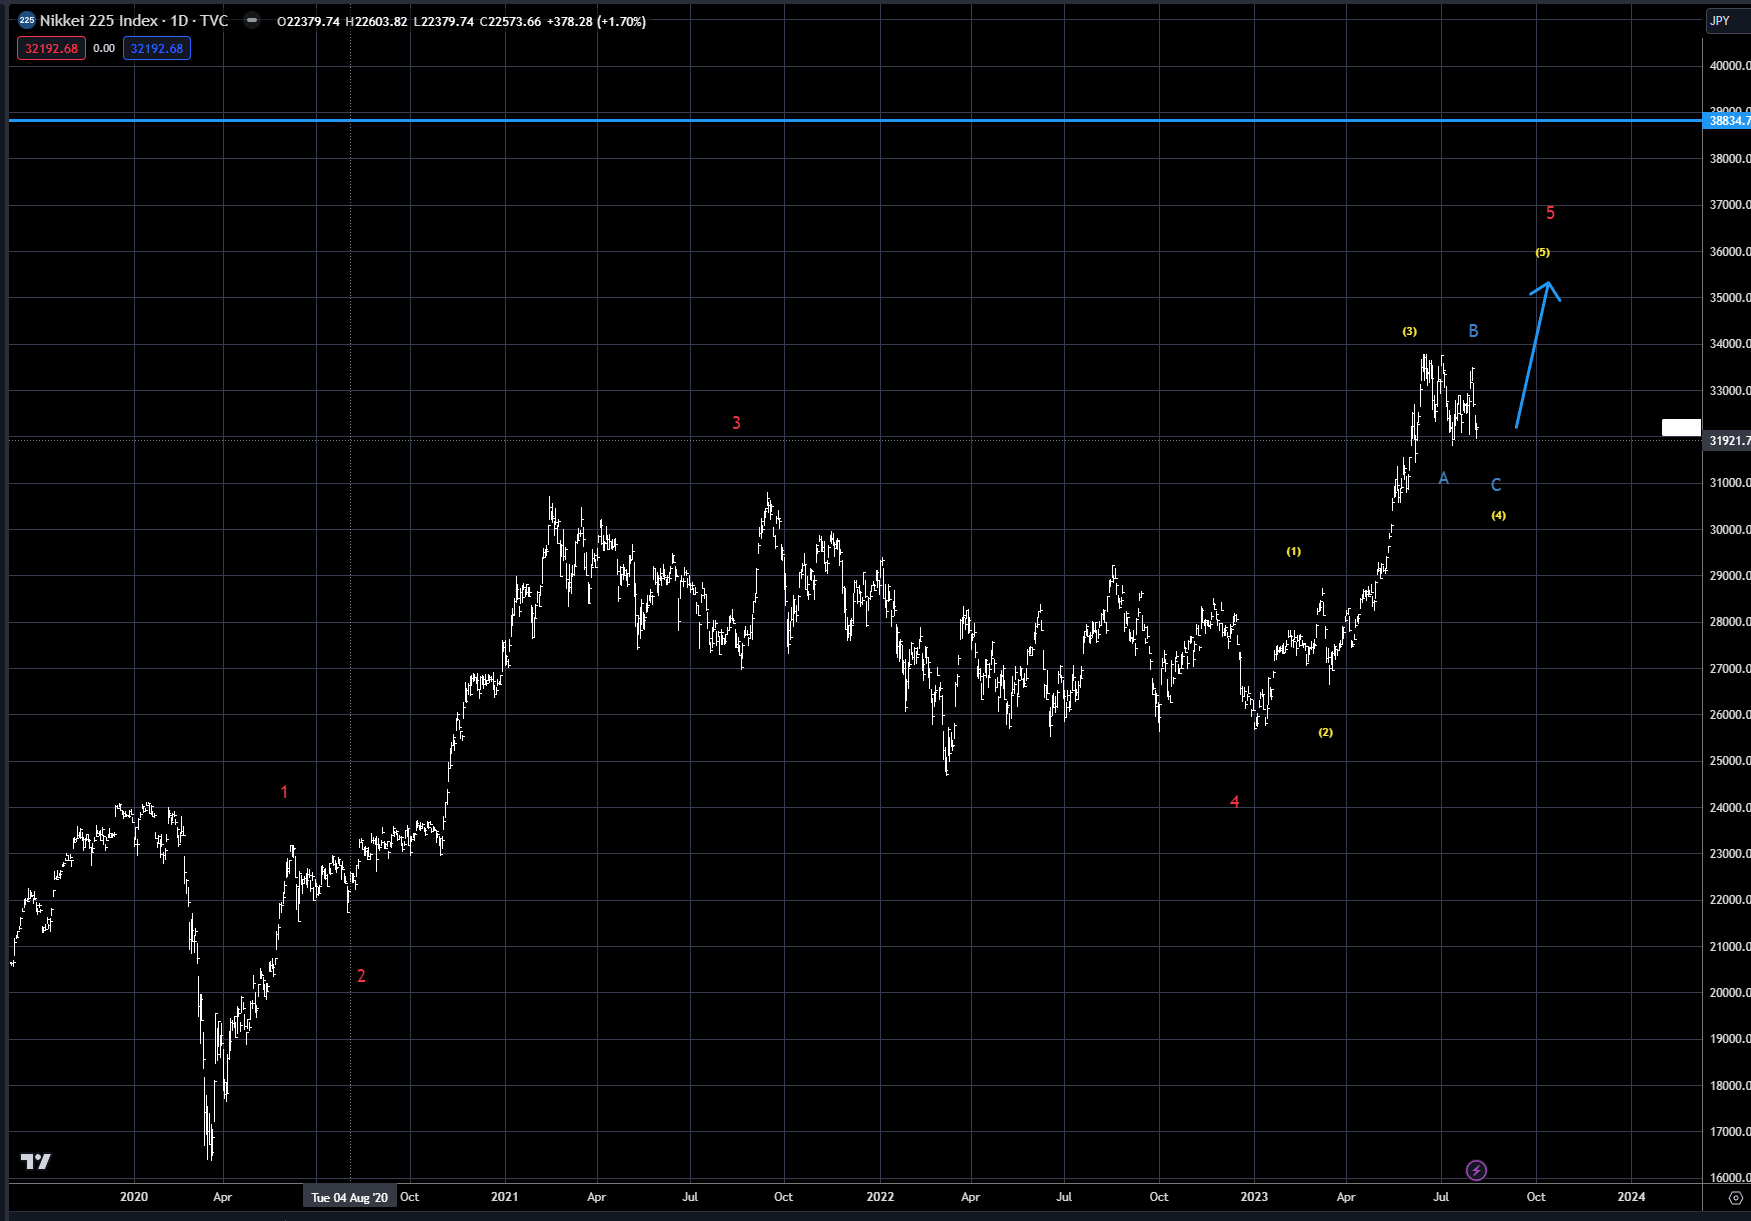
The Nikkei, shown in chart 7, is also in a wave 4 correction, as equities all seem to be highly correlated at the moment. The Nikkei still has the potential to reach its all-time highs (blue horizontal line) from the '90s before this move is complete, but the corrective phase must get completed first.
For this week, watch the 32,000 level, which has held the past few weeks. If the US markets move lower as expected, the Nikkei should also move below 32,000. The next big level of support is near 31,000, which is the old highs from 2021. This area seems to be a logical technical level to hold the correction next week. The market will still need some base building prior to the final move higher – wave 5. Patience is again important this week.
Chart 7: Nikkei
In our most recent deep dive, we began to focus on the outlook for commodities. Chart 8 is the daily price for the S&P GSCI index, which, as we outlined in our report, indicates a potential long-term double top was made. We also argued the market was short-term oversold and due for a corrective rally.
As you can see from chart 8, the pullback from the 2020 rally held both the Fibonacci 50% correction level and the old highs near 500 (horizontal blue line), and is now base building. With Russia and Ukraine now a wild card, in the short term oil, natural gas and wheat/corn could drive the overall commodity complex higher until a resolution is found.
Chart 8: S&P GSCI index
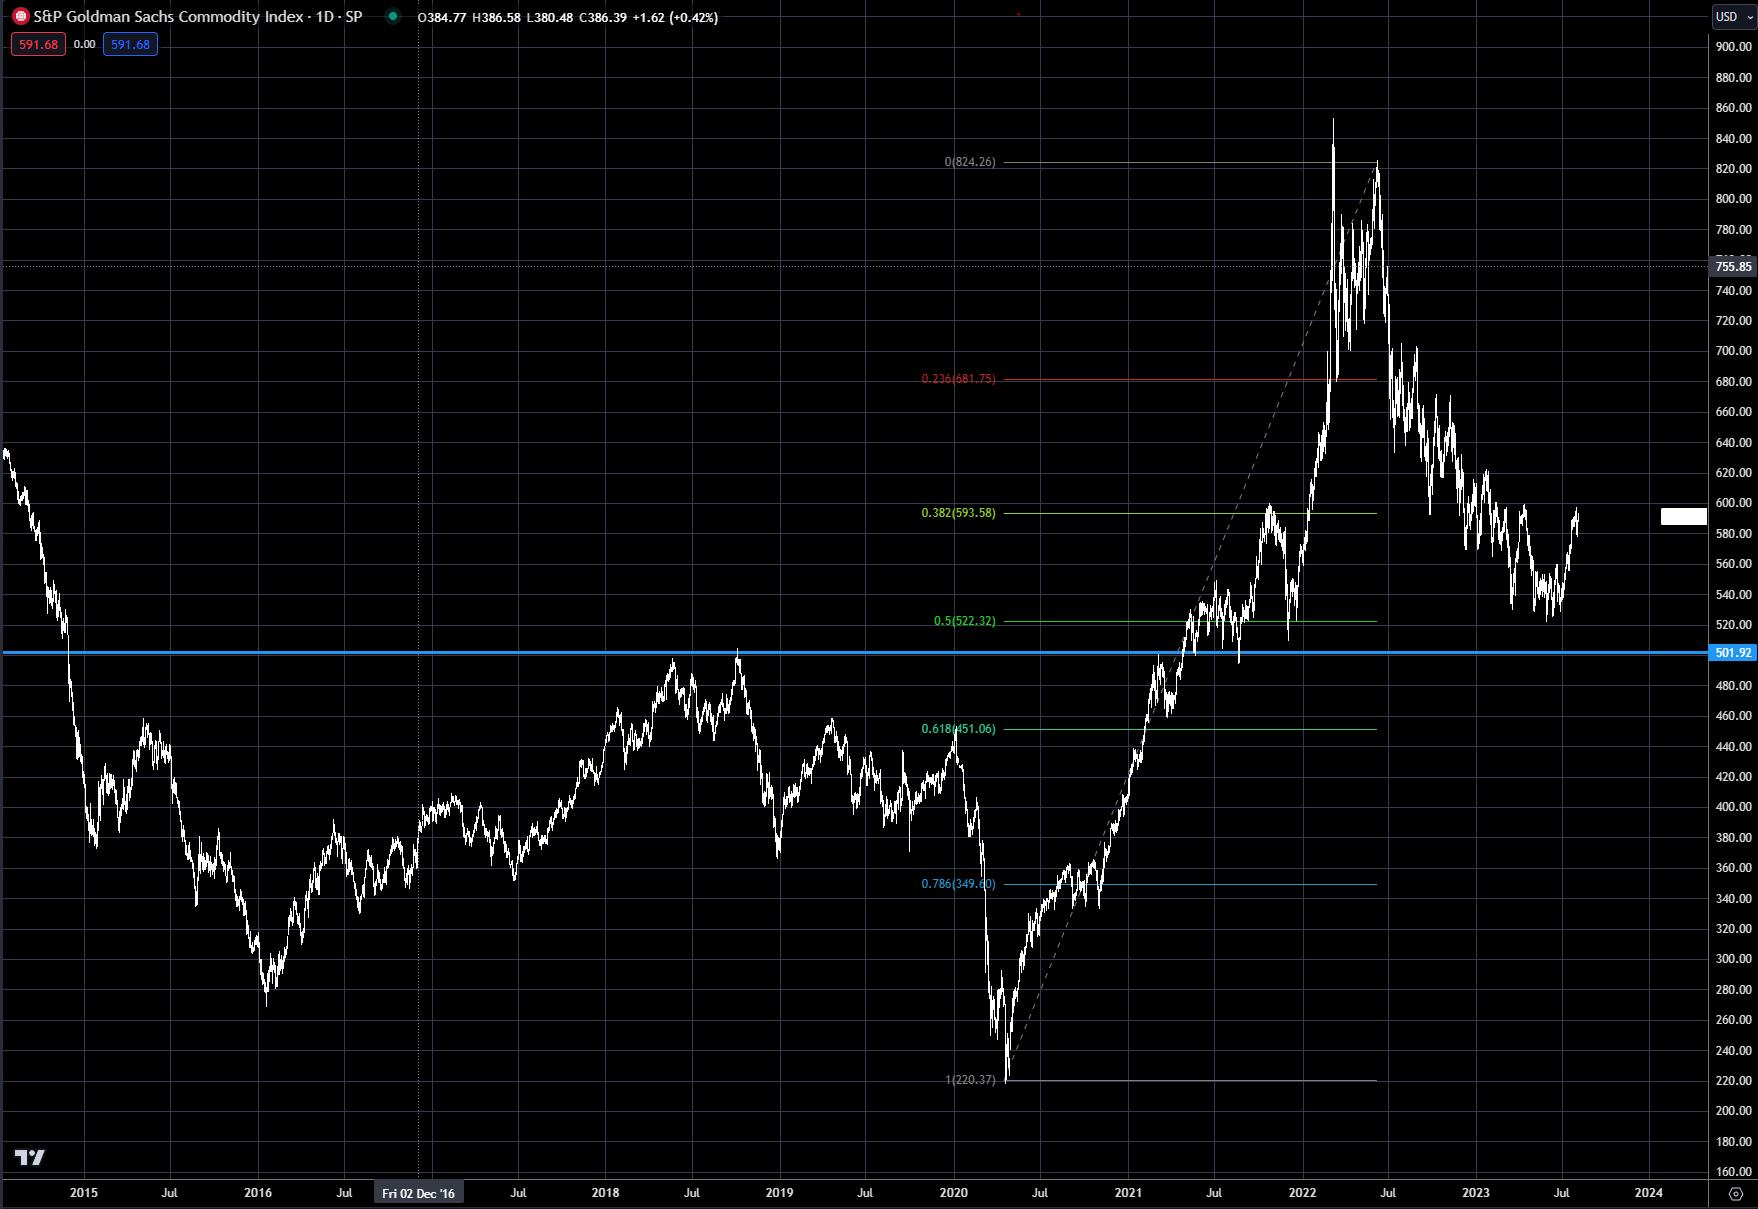
Chart 9: Meta stock price
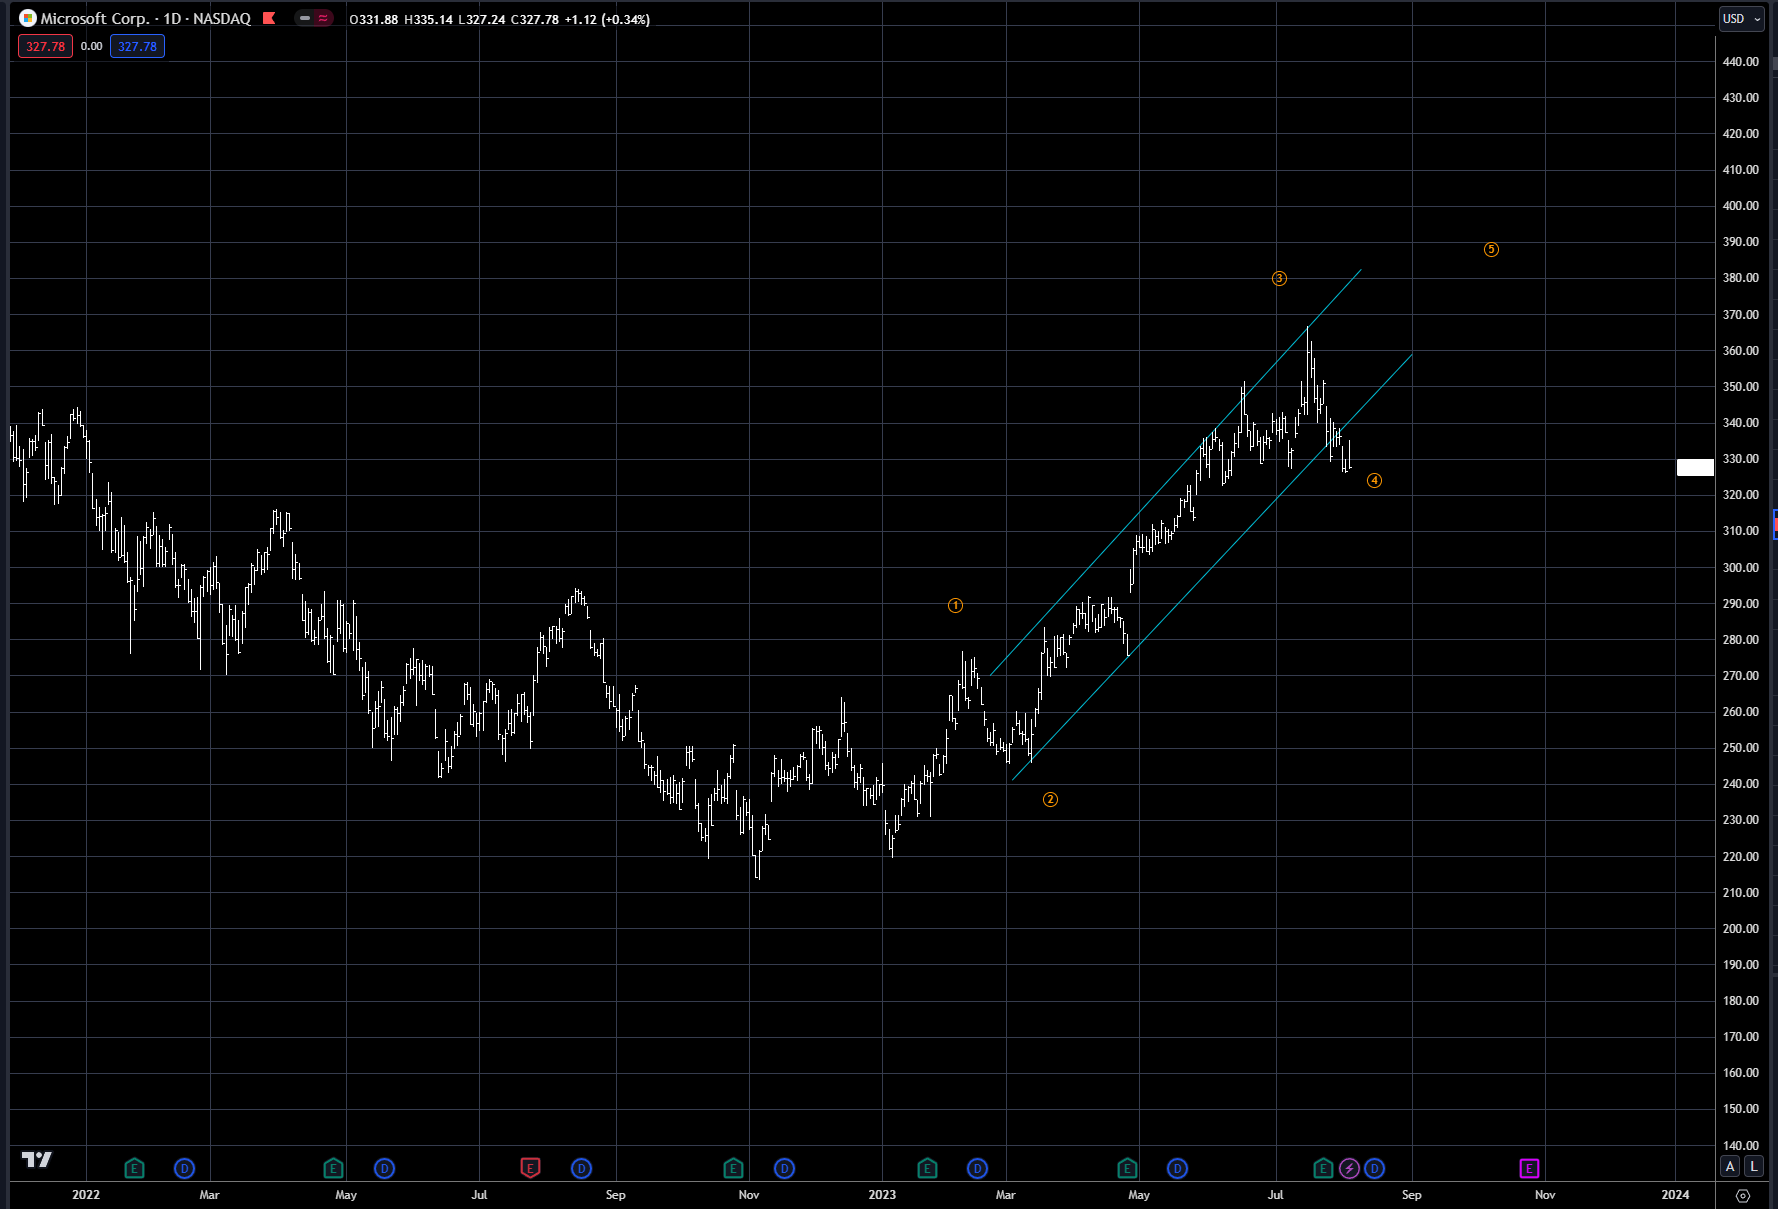
Chart 10: Microsoft stock price
Trading strategy is based on the author's views and analysis as of the date of first publication. From time to time the author's views may change due to new information or evolving market conditions. Any major updates to the author's views will be published separately in the author's weekly commentary or a new deep dive.
This content is for educational purposes only and is NOT financial advice. Before acting on any information you must consult with your financial advisor.