An In-Depth Look at The German Dax Index
Author: Bruce Liegel
The German Dax made new all-time highs last week, and as Chart 1 shows it has been on a tear over the last few weeks as the market is now aggressively pricing in a dovish interest-rate policy change by global central banks. The so-called “pivot” is now in full force, with at least 3-4 interest-rate cuts now priced in the market for 2024.
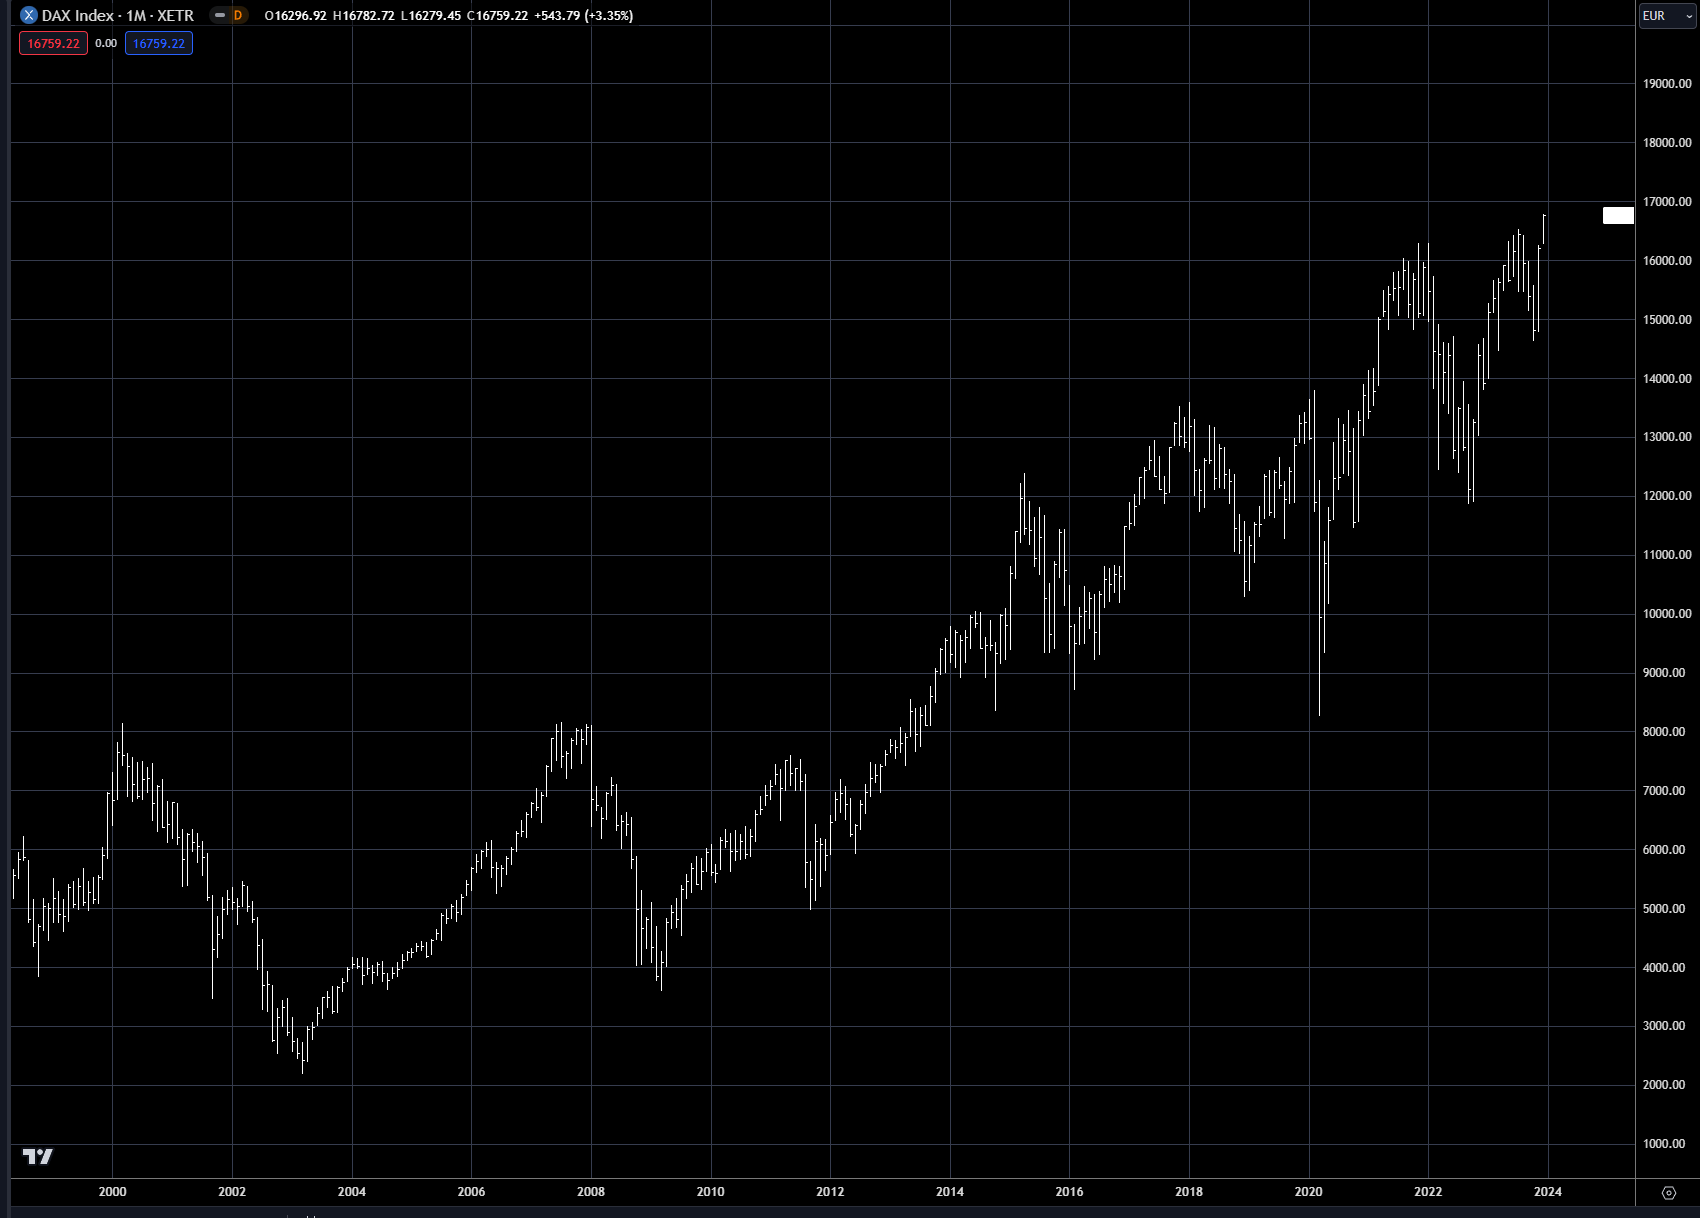
Chart 2 shows the longer view of the Dax and, like the US markets, it has been in a long-term bull market following the easy monetary polices discussed in other weeklies and deep dives. The question going forward is: how much more can the market churn higher if central banks do not pivot into a rate-cutting mode in 2024? If truly 'higher for longer' is the correct mantra, the Dax could be quite overvalued.
Chart 1: German Dax short-term chart
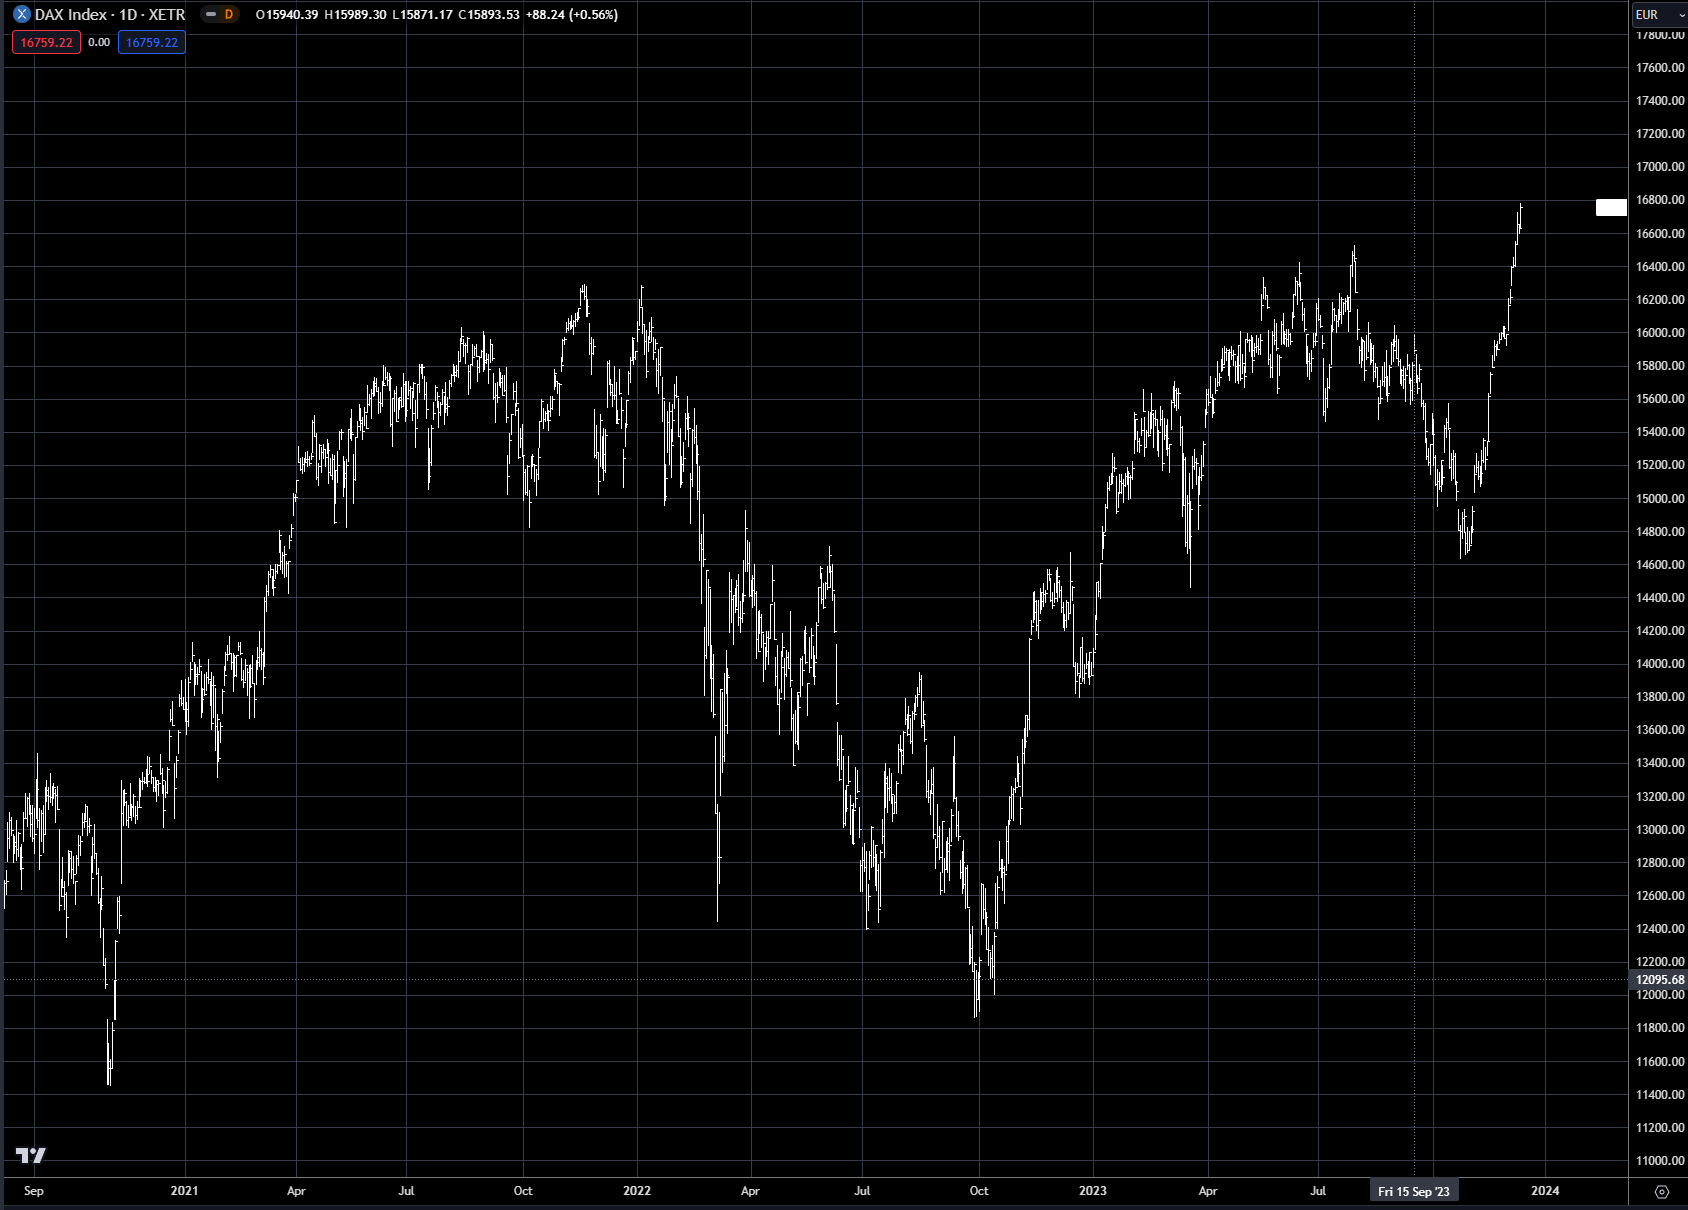
Chart 2: German Dax long-term chart
Germany’s economic data has been nothing to get too excited about, but there are some areas beginning to act positive. Charts 3-6 lay out of some of the key economic indicators that are important to watch for clues to the German economy. Annual growth in all of Europe has been pretty anemic, with German growth near flat for the last few years, as shown in Chart 3.
Inflation is coming down quite quickly as it appears that Germany’s energy-importing issue has been solved, at least in the short run. The long term could be a different story as Germany transitions to a green-friendly power grid, which could make them quite uncompetitive until a cheap reliable source is available. Chart 4 shows inflation well off its peak from last year - currently just above 3%.
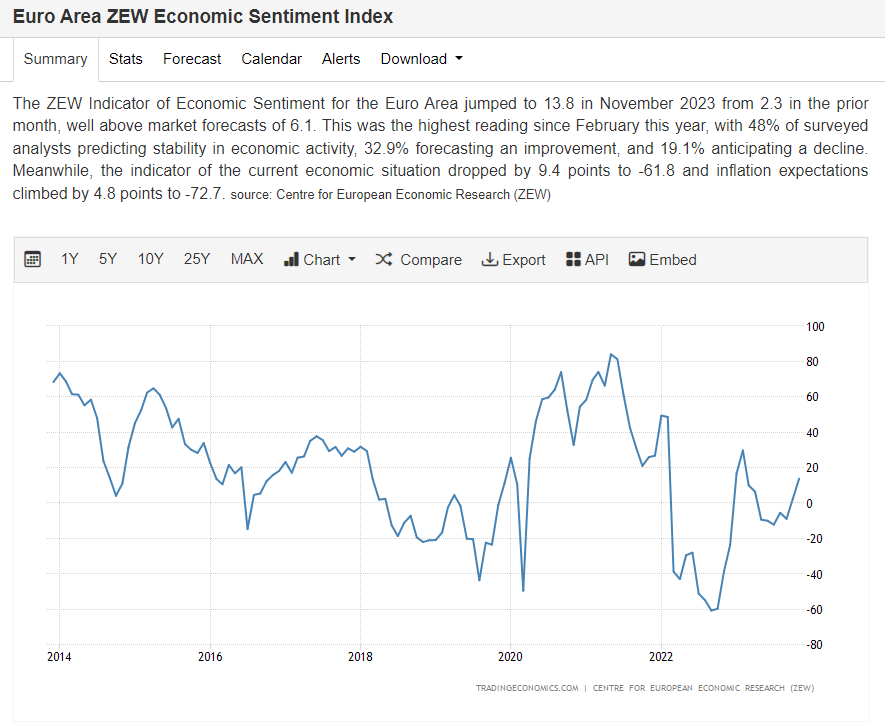
Charts 4 and 5 show the IFO and ZEW data surveys, both of which are turning up, indicating the German economy could be picking up steam in the months ahead. IF interest rates do indeed ease, this could be a beneficial booster for growth.
Chart 3
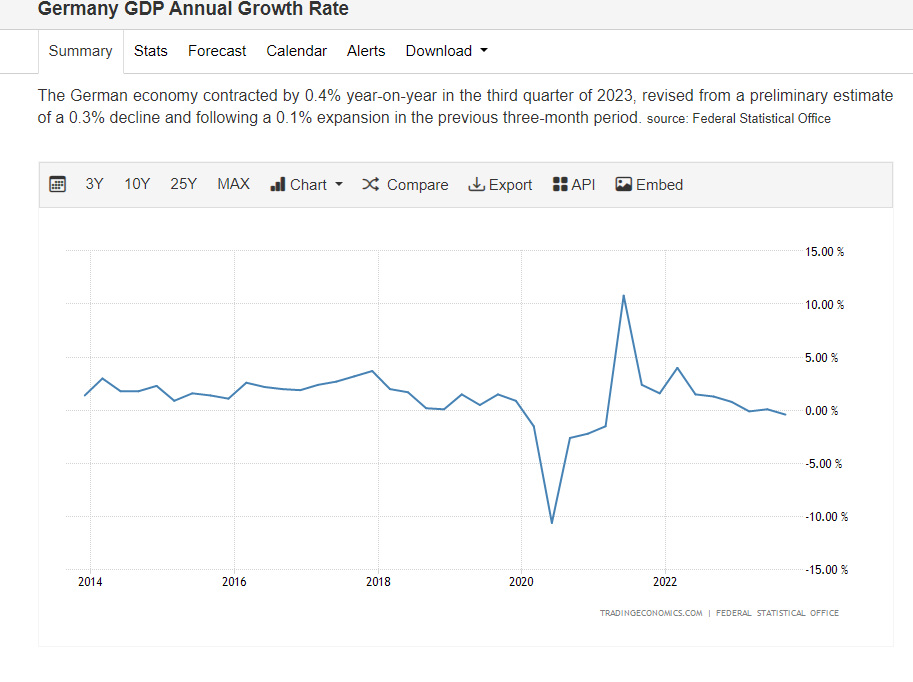
Chart 4
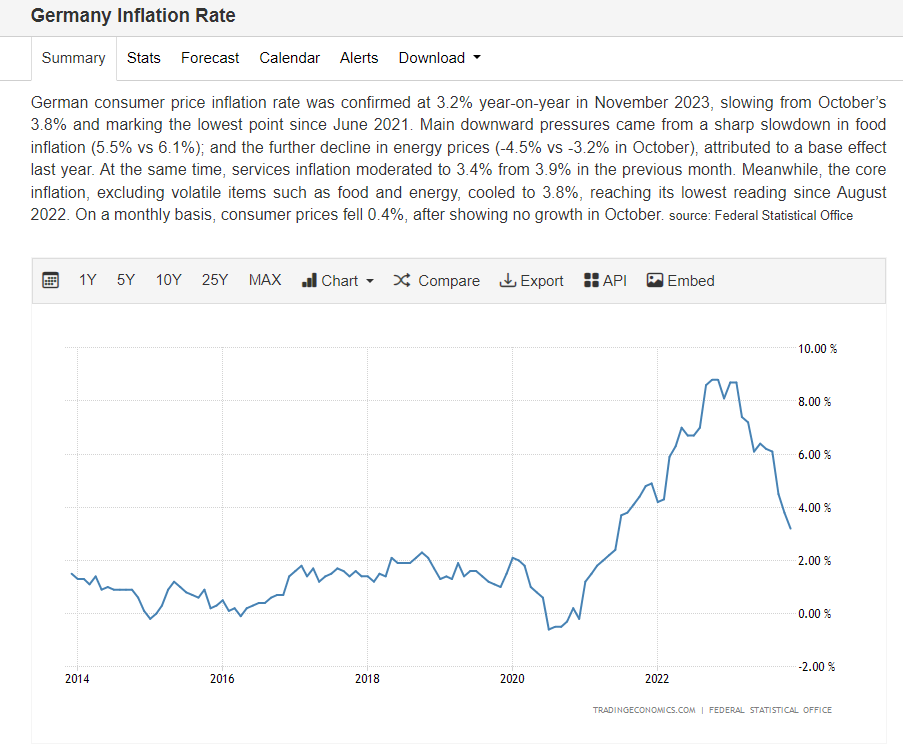
Chart 5
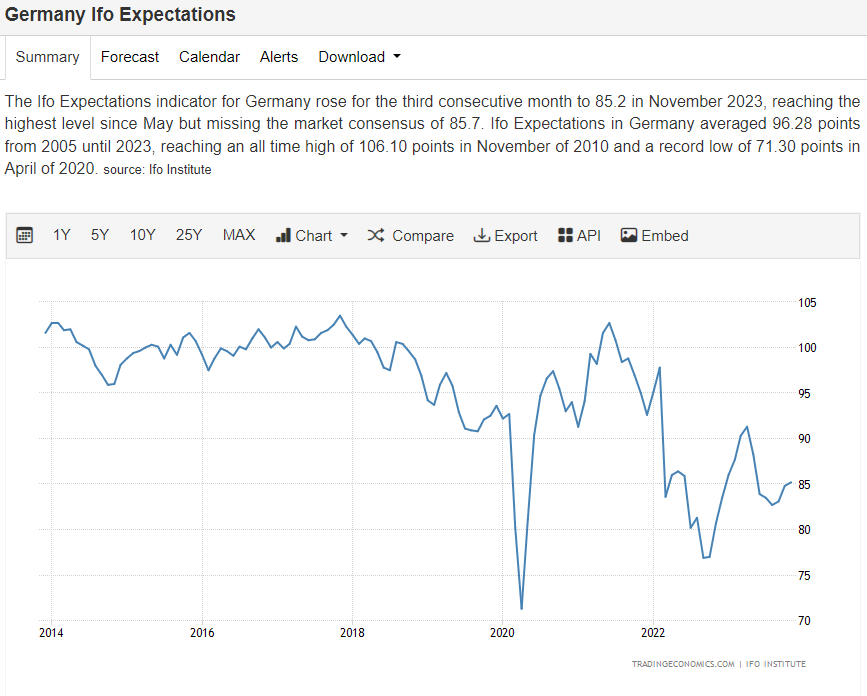
Chart 6
The German Dax index is the largest equity index traded in Germany, and one of the most liquid in the world. It is comprised of the largest 40 stocks traded on the Frankfurt Stock Exchange, with the sector components shown in Chart 7. The futures are traded on the Eurex, which also offers a number of other futures markets to trade.
The Dax index is quite diversified, with allocations across a number of market sectors - very similar to the DJIA in the US. Chart 8 shows the top 10 holdings, with a number of them household names here in the US, like Mercedes, DHL, Siemens and SAP.
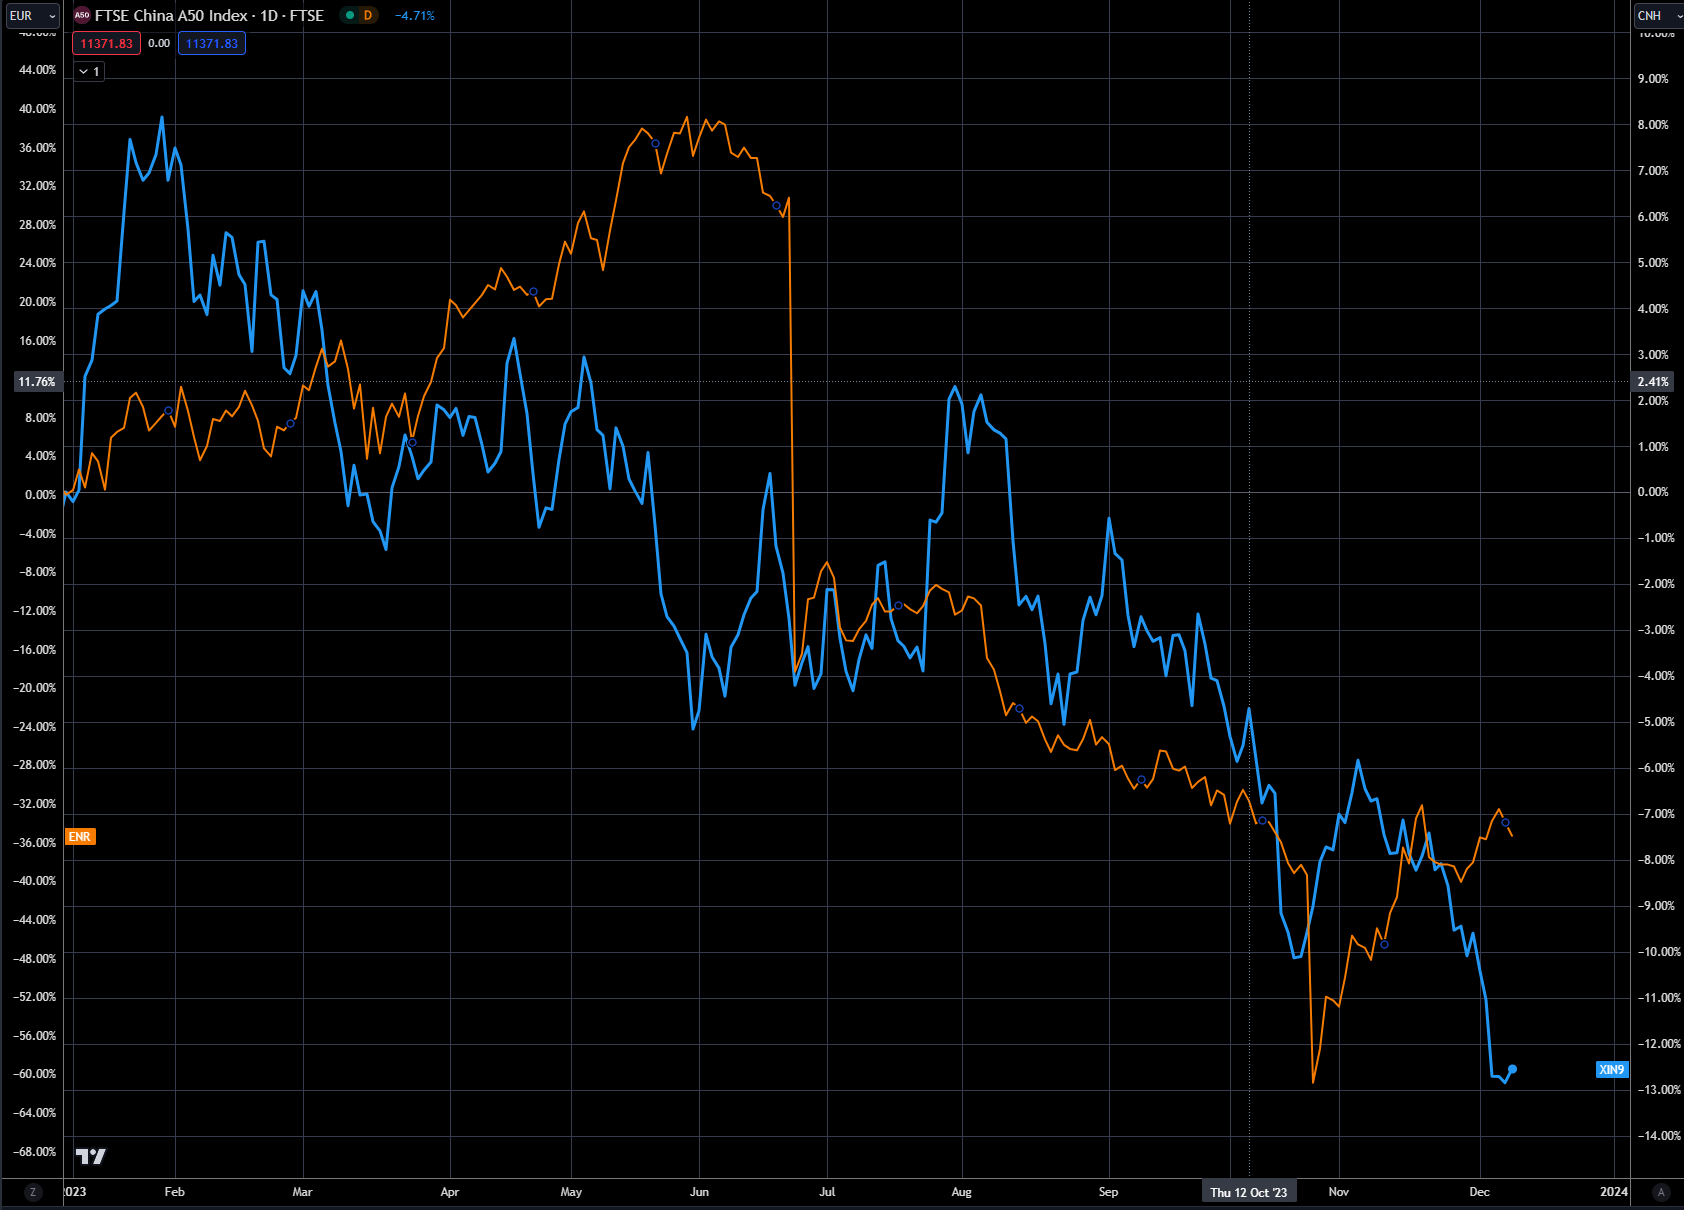
Chart 9 shows the performance of the top 10 stocks, with SAP leading the way - up over 50% on the year. IFX, or Infineon Technologies, is also a market leader, up over 30% on the year. As you can see, the Dax index does have some technology stocks that drive the overall returns, similar to the '7 horsemen' in the US. The big laggard in the index this year is Siemens, down over 30% - which follows the Chinese A-shares stock market. Chart 10 shows the correlation between Siemens and A-shares.
Chart 7: German Dax sector weights
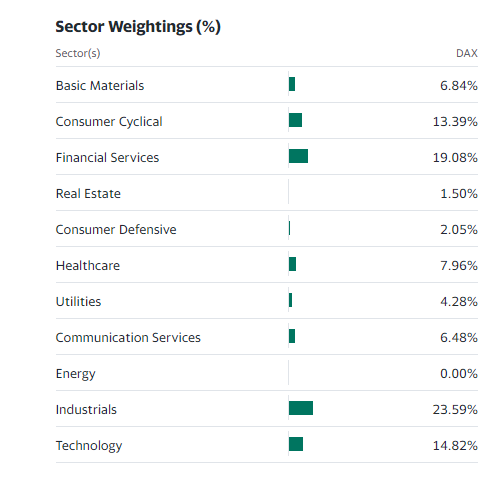
Chart 8
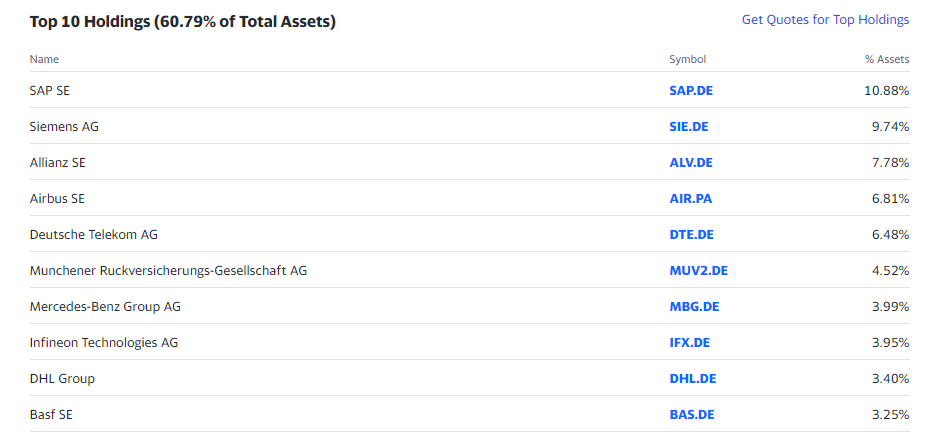
Chart 9: Dax top-10 stock returns for 2023
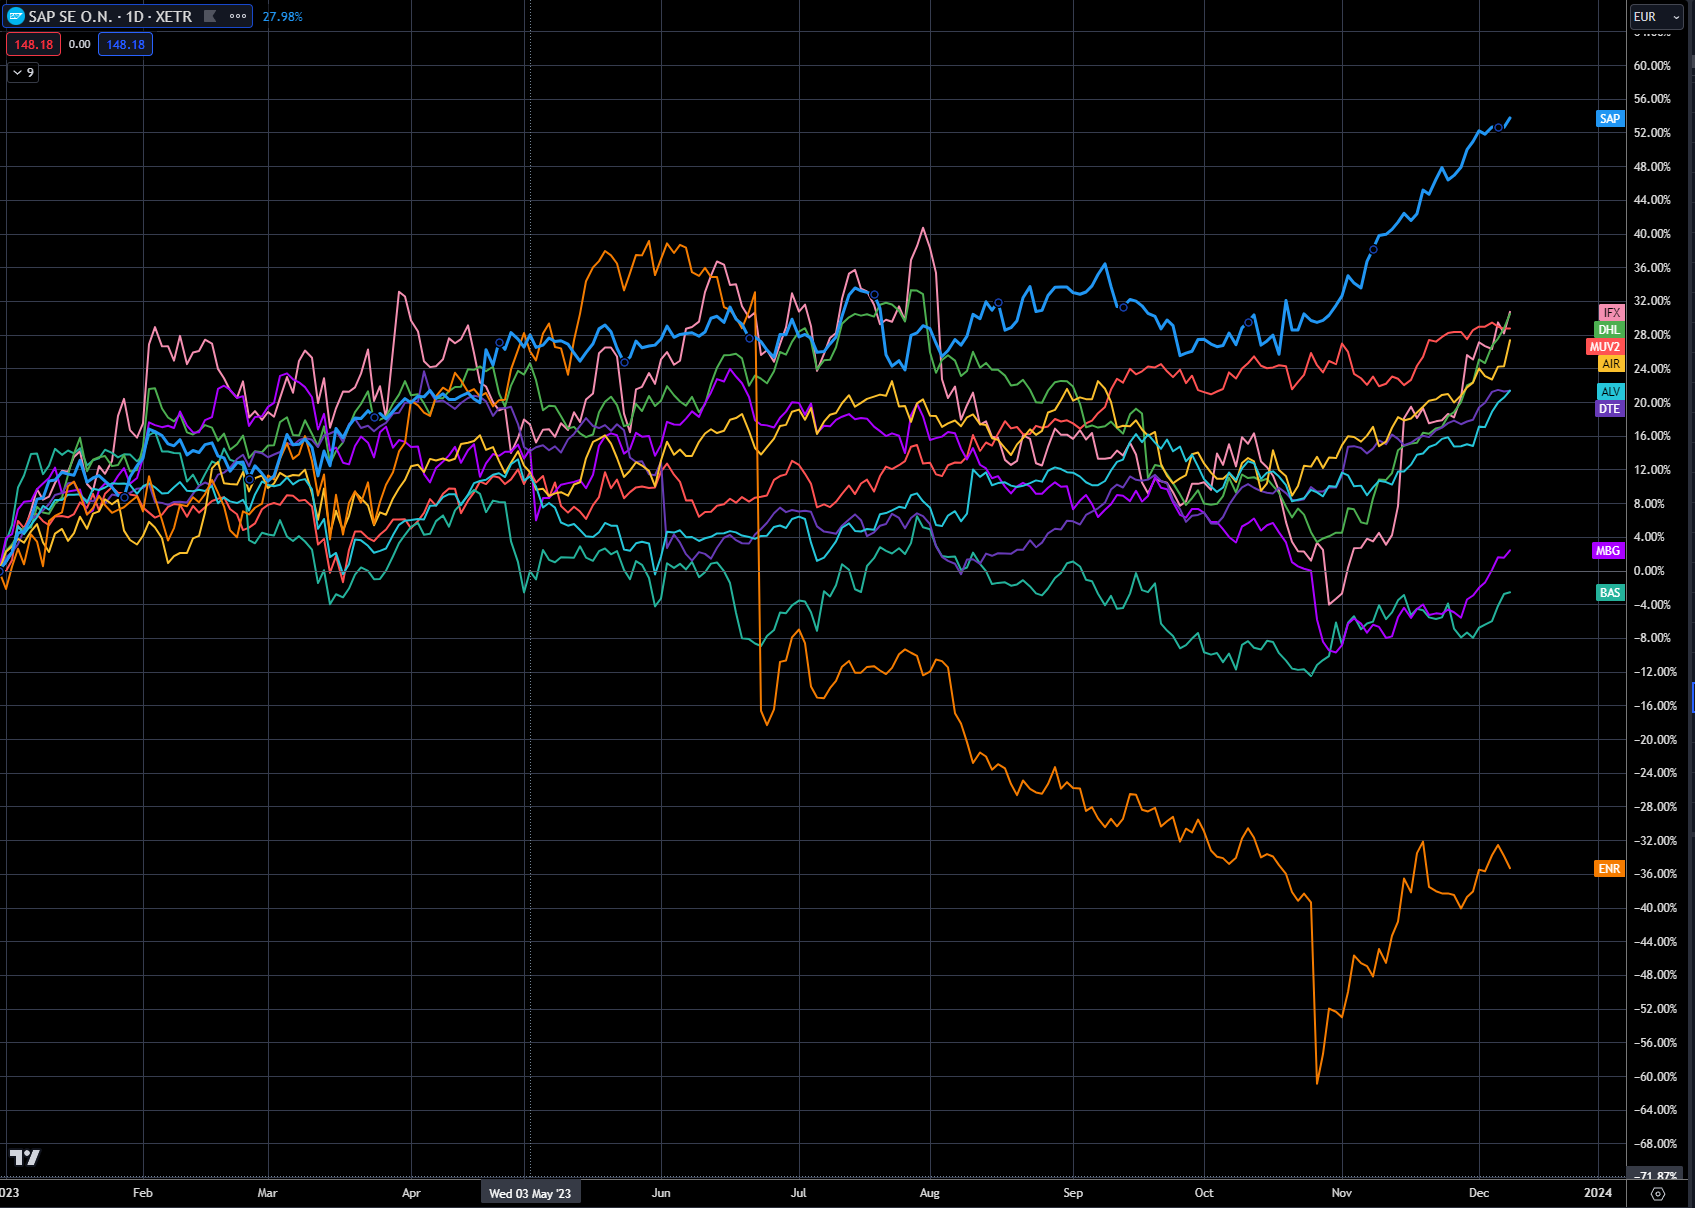
Chart 10: Siemens (ENE in Orange LHS) versus China A-shares in blue (RHS)
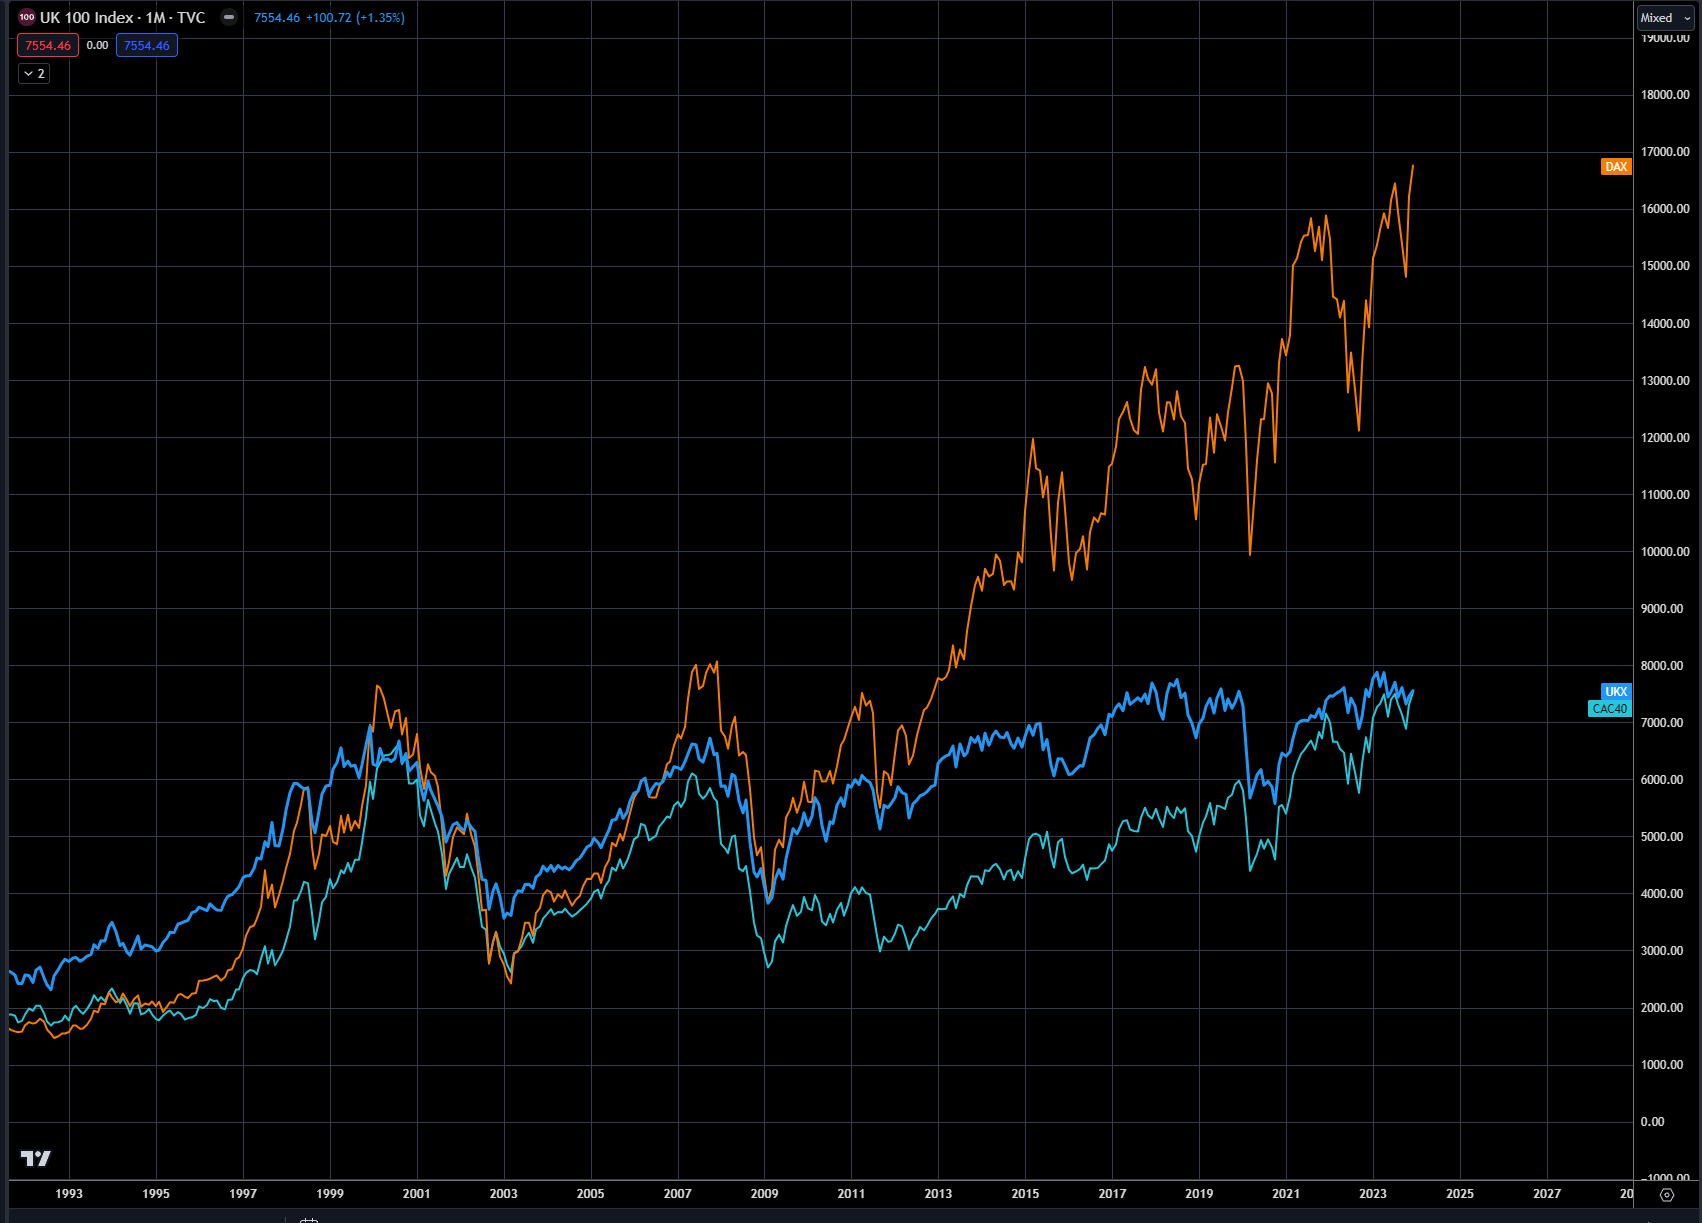
The German Dax was quite correlated to the other main stock markets in Europe prior to 2009, but that pretty much changed with the monetization of debt and the central bank printing presses unleashing trillions on the global economy. Germany has been the recipient of these flows, as its economy was far and wide the largest and best economy in Europe.
Chart 11 shows the long-term history of the Dax in orange versus the UK FTSE in blue and French CAC40 in green. The Dax has crushed the other two main indices in Europe over the past 10 years. How much longer the Dax can continue this impressive outperformance is up for debate, but with China an unknown going forward and energy reliance a potential issue, the time is getting close where we may see a dramatic mean reversion in this data series.
Chart 11: German Dax in orange, UK FTSE in blue and French Cac40 in green
The German economy's reliance on China's economy can be seen in Charts 12 and 13, with its high correlation to the China A-shares and the Hong Kong Hang Seng. Notice, though, the clear divergence with the Asian economies that started earlier this year, as the Dax broke away and has outperformed, while the Asian markets have continued to weaken.
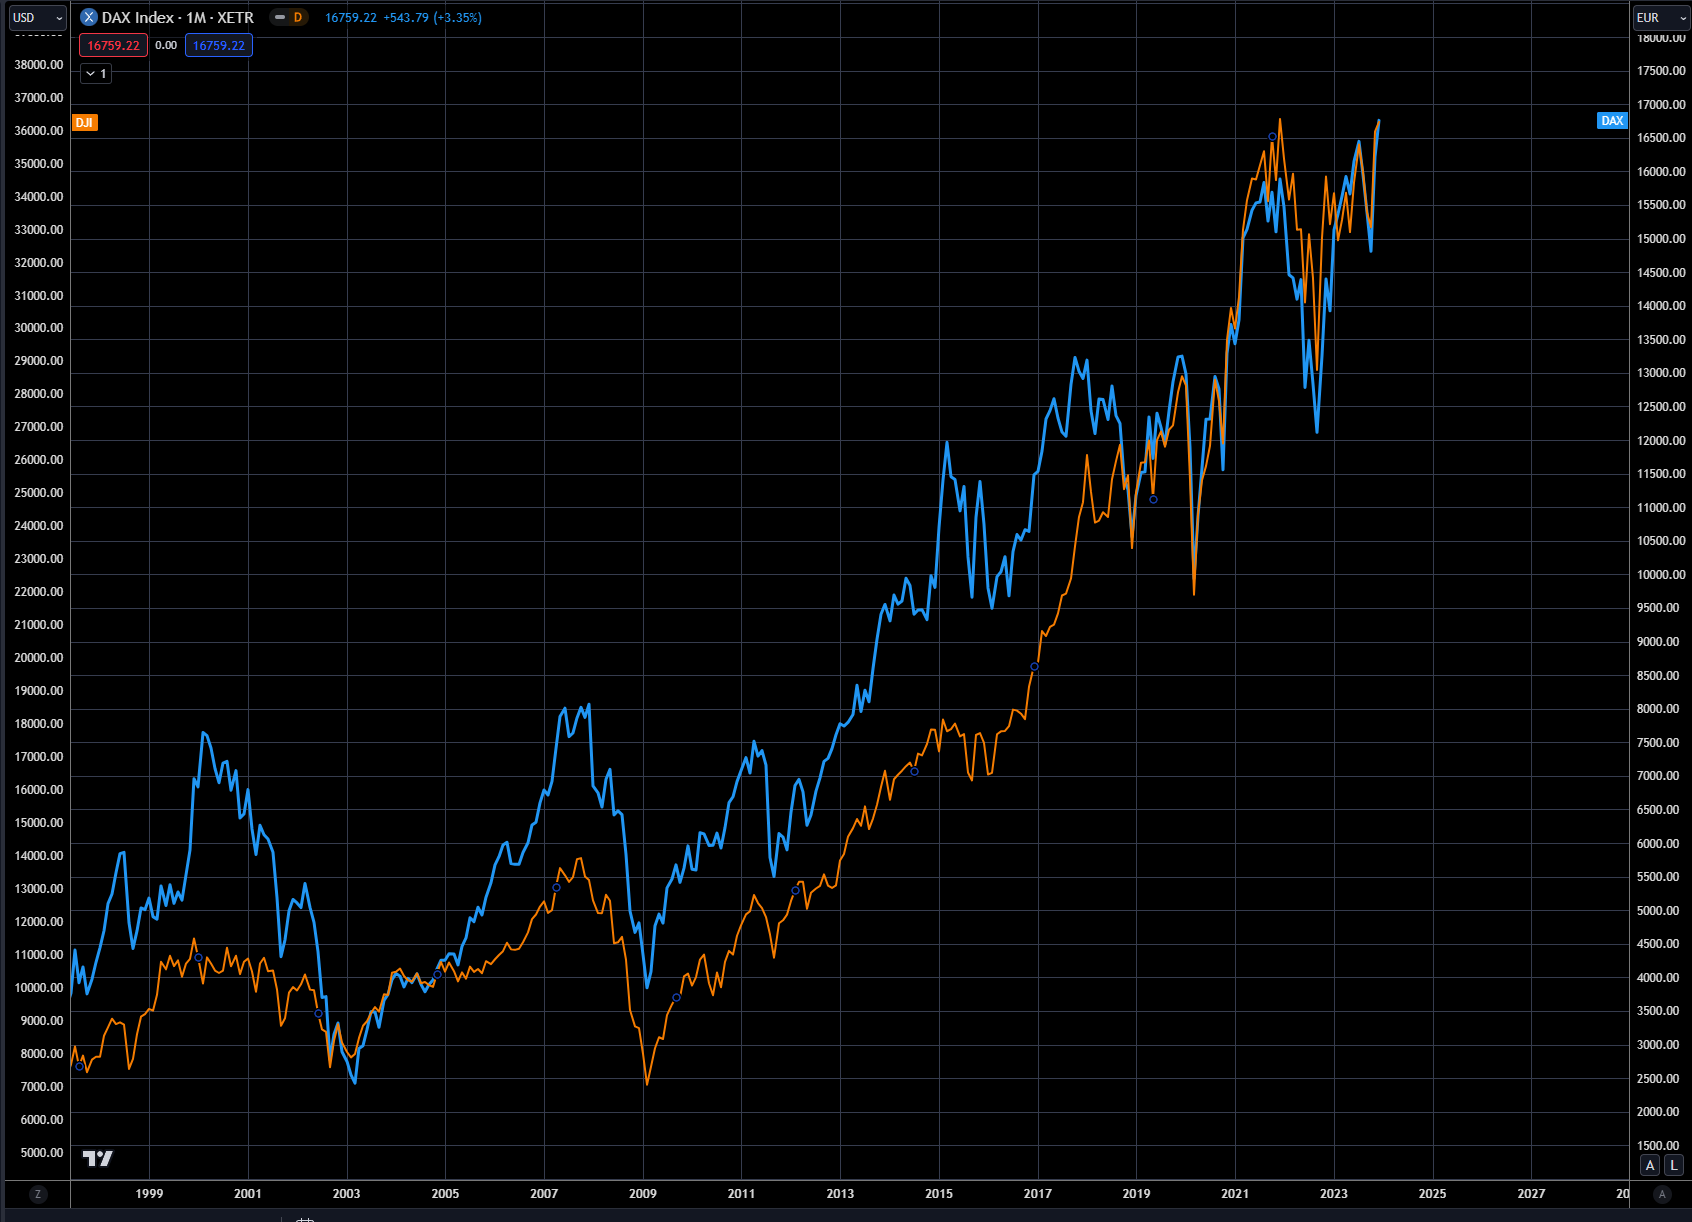
The main reason for this divergence has been that the German Dax has followed the US markets, as risk-on has been driven by a central bank potential easing cycle in 2024. This can be seen in Chart 14, which compares the Dax in blue (RHS) and the DJIA in orange (LHS). It is obviously clear that the Dax has followed the DJIA for a long time - this data series goes back 25 years, but the correlation is much closer tied since the first quarter of this year.
It is a bit unnerving that so many equity markets are so intertwined - with correlations so high, diversification offers little support in the event of a sustainable market correction. A correction of the 2007 magnitude could be massively more impactful, with valuations of most equity markets at extreme levels.
Chart 12: Dax in blue and China A-shares in orange
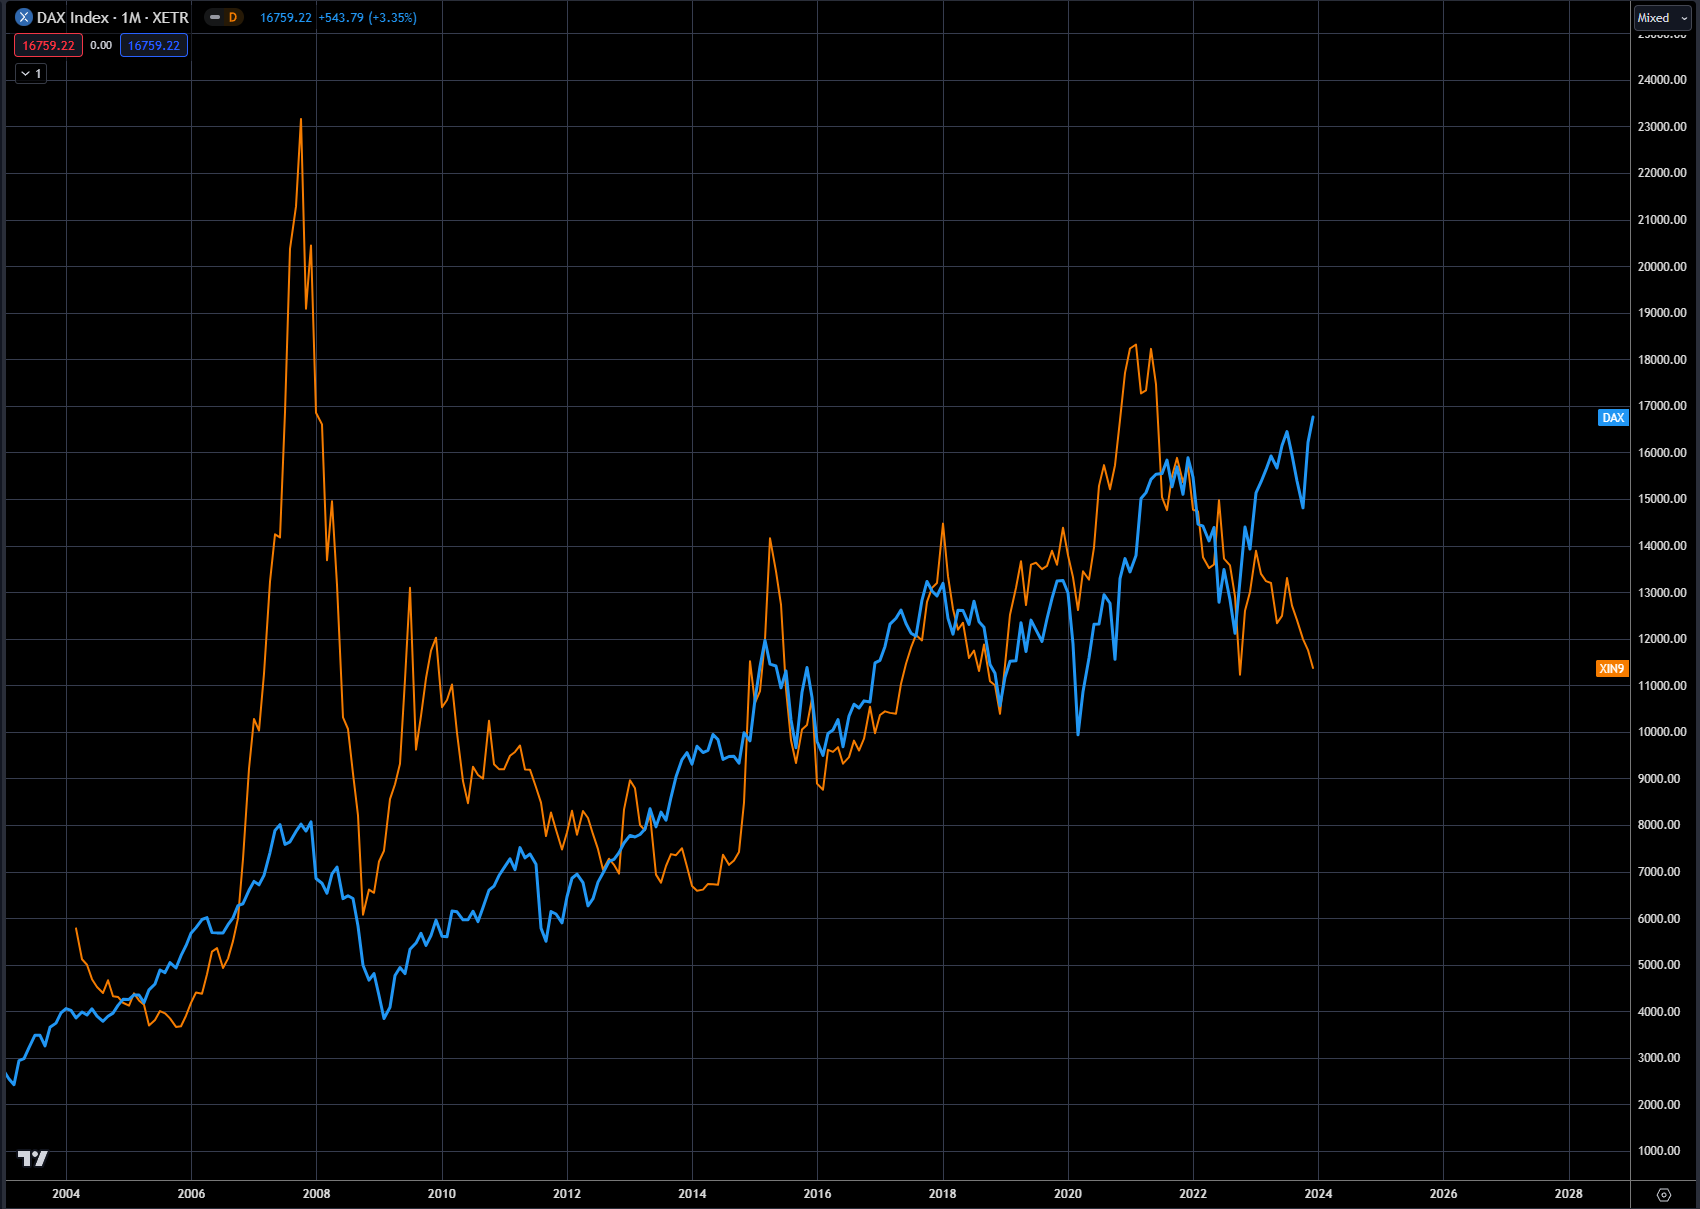
Chart 13: Dax in blue and Hang Seng in orange (LHS)
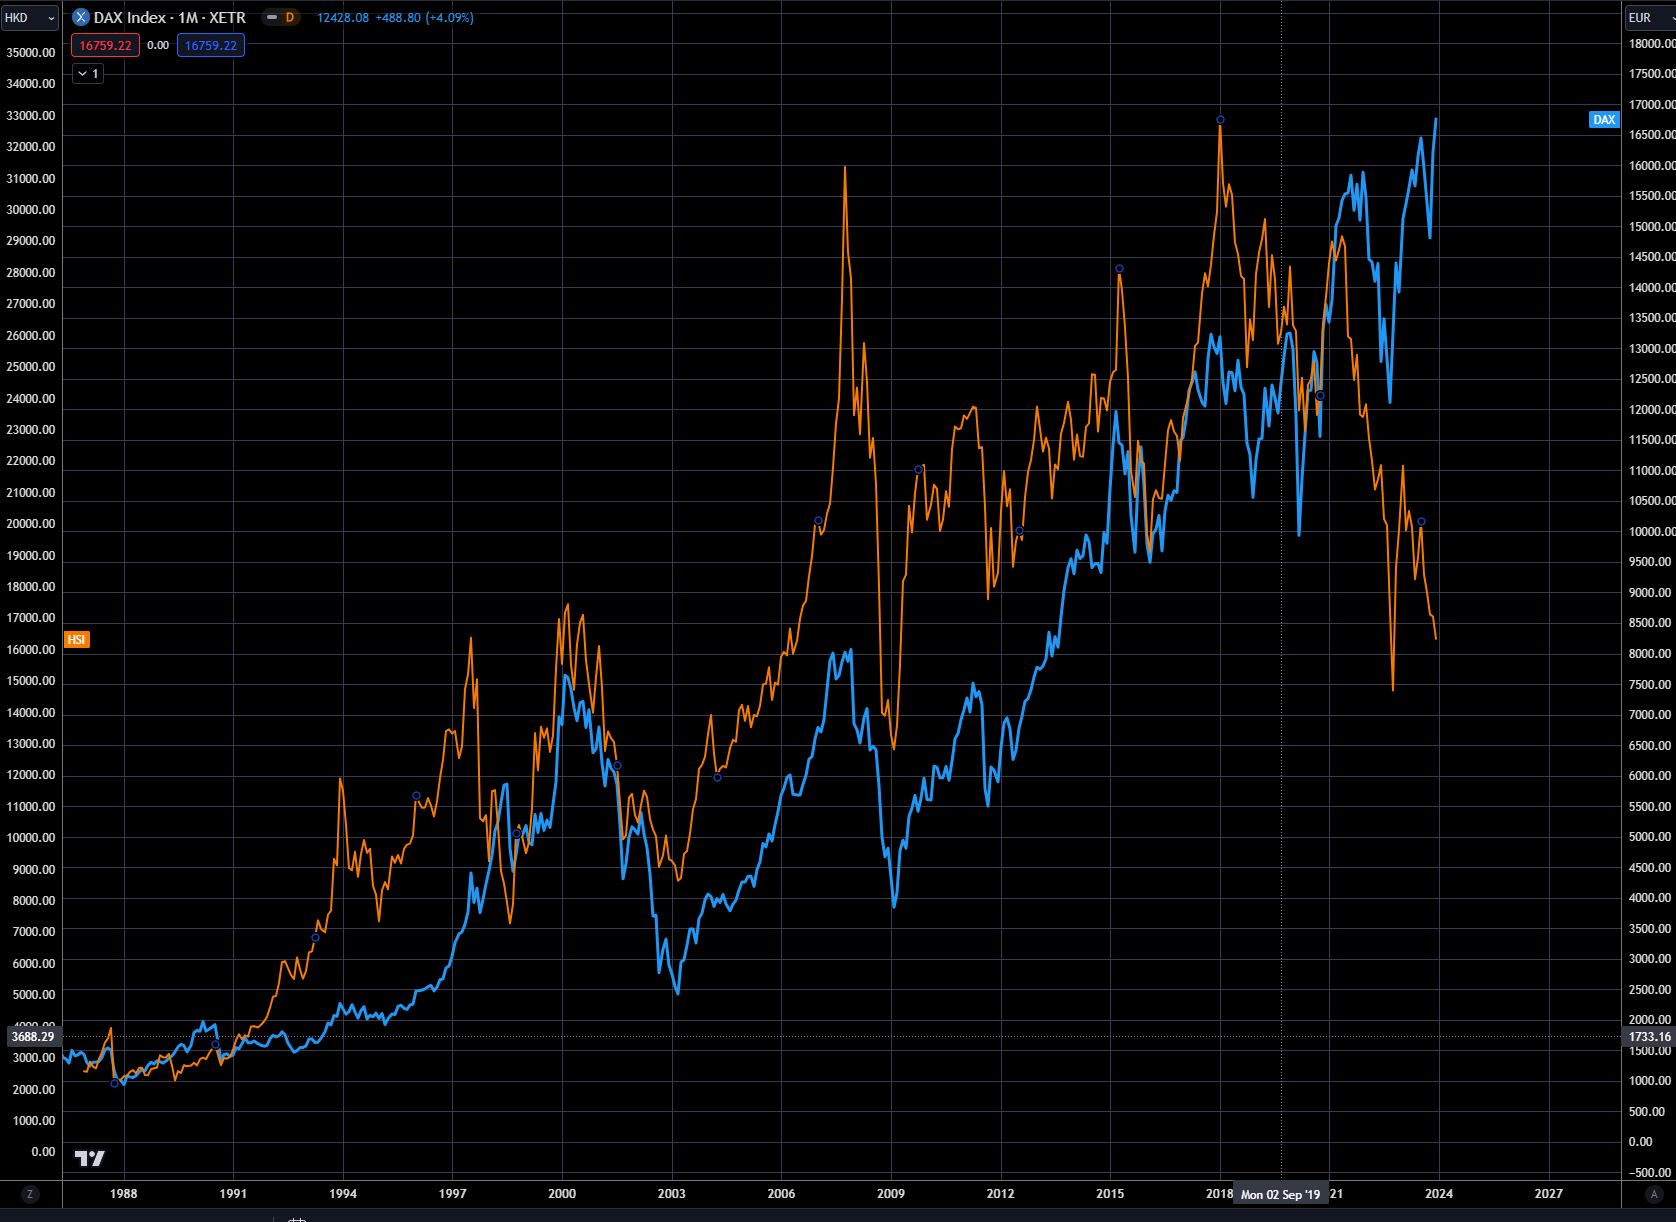
Chart 14: Dax in blue and DJIA in orange (LHS)
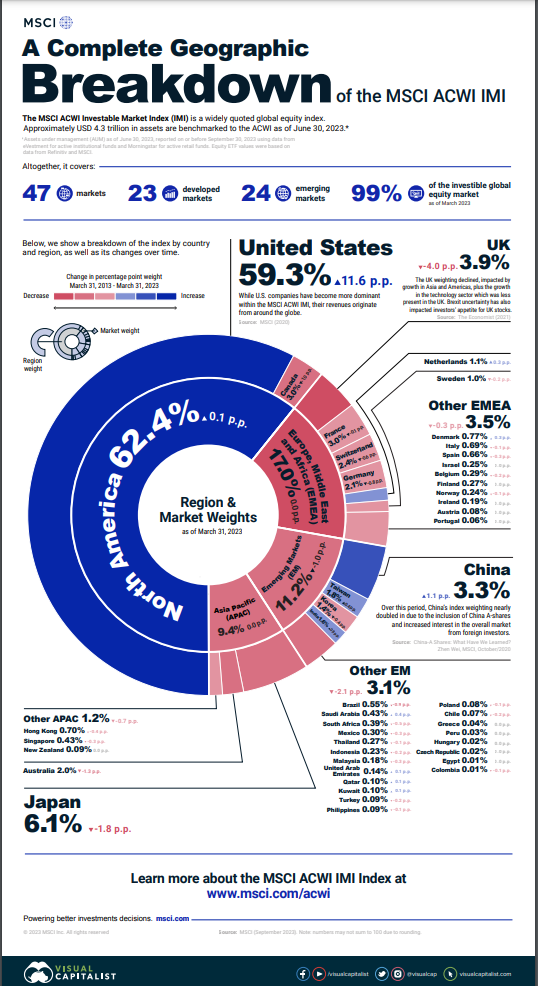
The final correlation compares the Dax and the MSCI index, and clearly shows how pegged these equity markets are to each other. Chart 15 shows this comparison and Chart 16 is a breakdown of the MSCI index. The MSCI is a global index, comprising a number of global indices in one index. The fact that Germany and the MSCI are running side by side clearly shows that money flows are dominating asset allocation. This again will not bode well when the tide turns and the market retreats.
So yes, the Dax is breaking out to new all-time highs, but caution is in the air also. IF the central banks live up to their word and 'higher for longer' is correct, the markets may have a surprise waiting for them in 2024
Chart 15: Dax in blue (RHS) and MSCI in orange (LHS)
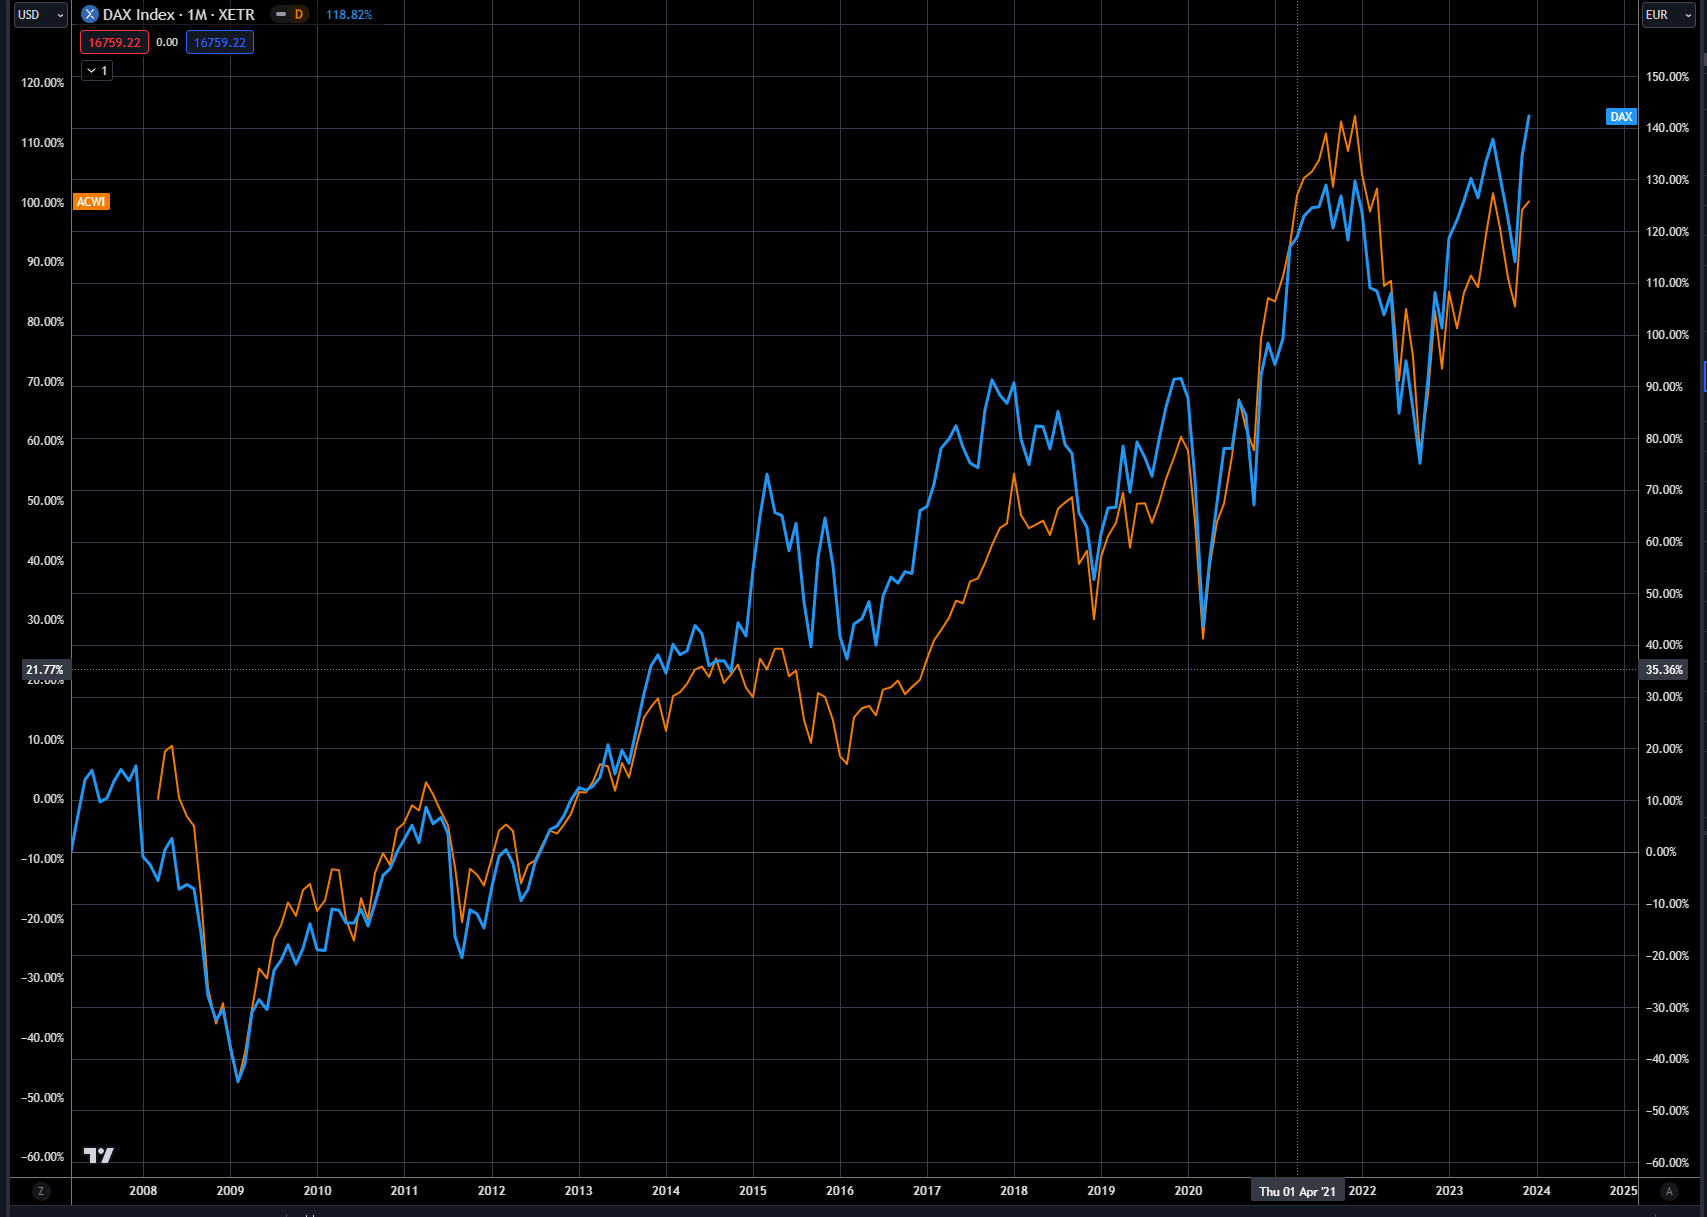
Chart 16
Trading strategy is based on the author's views and analysis as of the date of first publication. From time to time the author's views may change due to new information or evolving market conditions. Any major updates to the author's views will be published separately in the author's weekly commentary or a new deep dive.
This content is for educational purposes only and is NOT financial advice. Before acting on any information you must consult with your financial advisor.