Equities Rally While US bond Rates Fall
Author: Bruce Liegel
A very sharp move in markets last week, much greater than what we thought could occur when we penned our article last weekend.
A number of large institutional investors were calling for market reversals last week just prior to the Federal Reserve meeting. As is usually the case, these large investors will take a large position and then do the medial dog-and-pony show, arguing why the market should move in their direction. This opining was done last week on the level of interest rates, with these large traders arguing that the Fed was done hiking and was positioned for lower yields. They also sow the seeds of economic demise, to instill the fear factor in those who were listening.
Over the course of trading for 30 years, I have seen this 'front-running' media exploitation a number of times - normal during a TV/radio interview, but with social media today the impacts are much more dynamic as they can reach a broader audience quicker and with just a subtle post with their trade idea. These types of comments, if they are impactful, can result in a snowball effect, which is what we saw last week as the masses were lured into getting long stocks and bonds before the Hotel California’s doors were closed.
Yes, this market action is a trap for those thinking this is the 'bottom' in stocks or the 'high' in yields. In equities, last week’s price action was articulated in our piece published October 30, where we argued the first wave down was complete, especially in the Russell 2000. The anticipated correction should have taken 3-6 weeks, and may still do that, but in Nasdaq’s case the rally took us right back up the downtrend line from the July high, which should mark the first resistance in this correction. See Chart 1.
Chart 2 shows the S&P500, with last week’s rally almost 250 points, or just under 6% on the week. Here again, the rally is approaching the downtrend line from the July high. The 4400 level is also the 50% Fibonacci level for the move lower since July. If we truly are in a 'bull' market, at a minimum we should see some back-filling in price action this week. If it’s a bigger bear market, time will let us know.
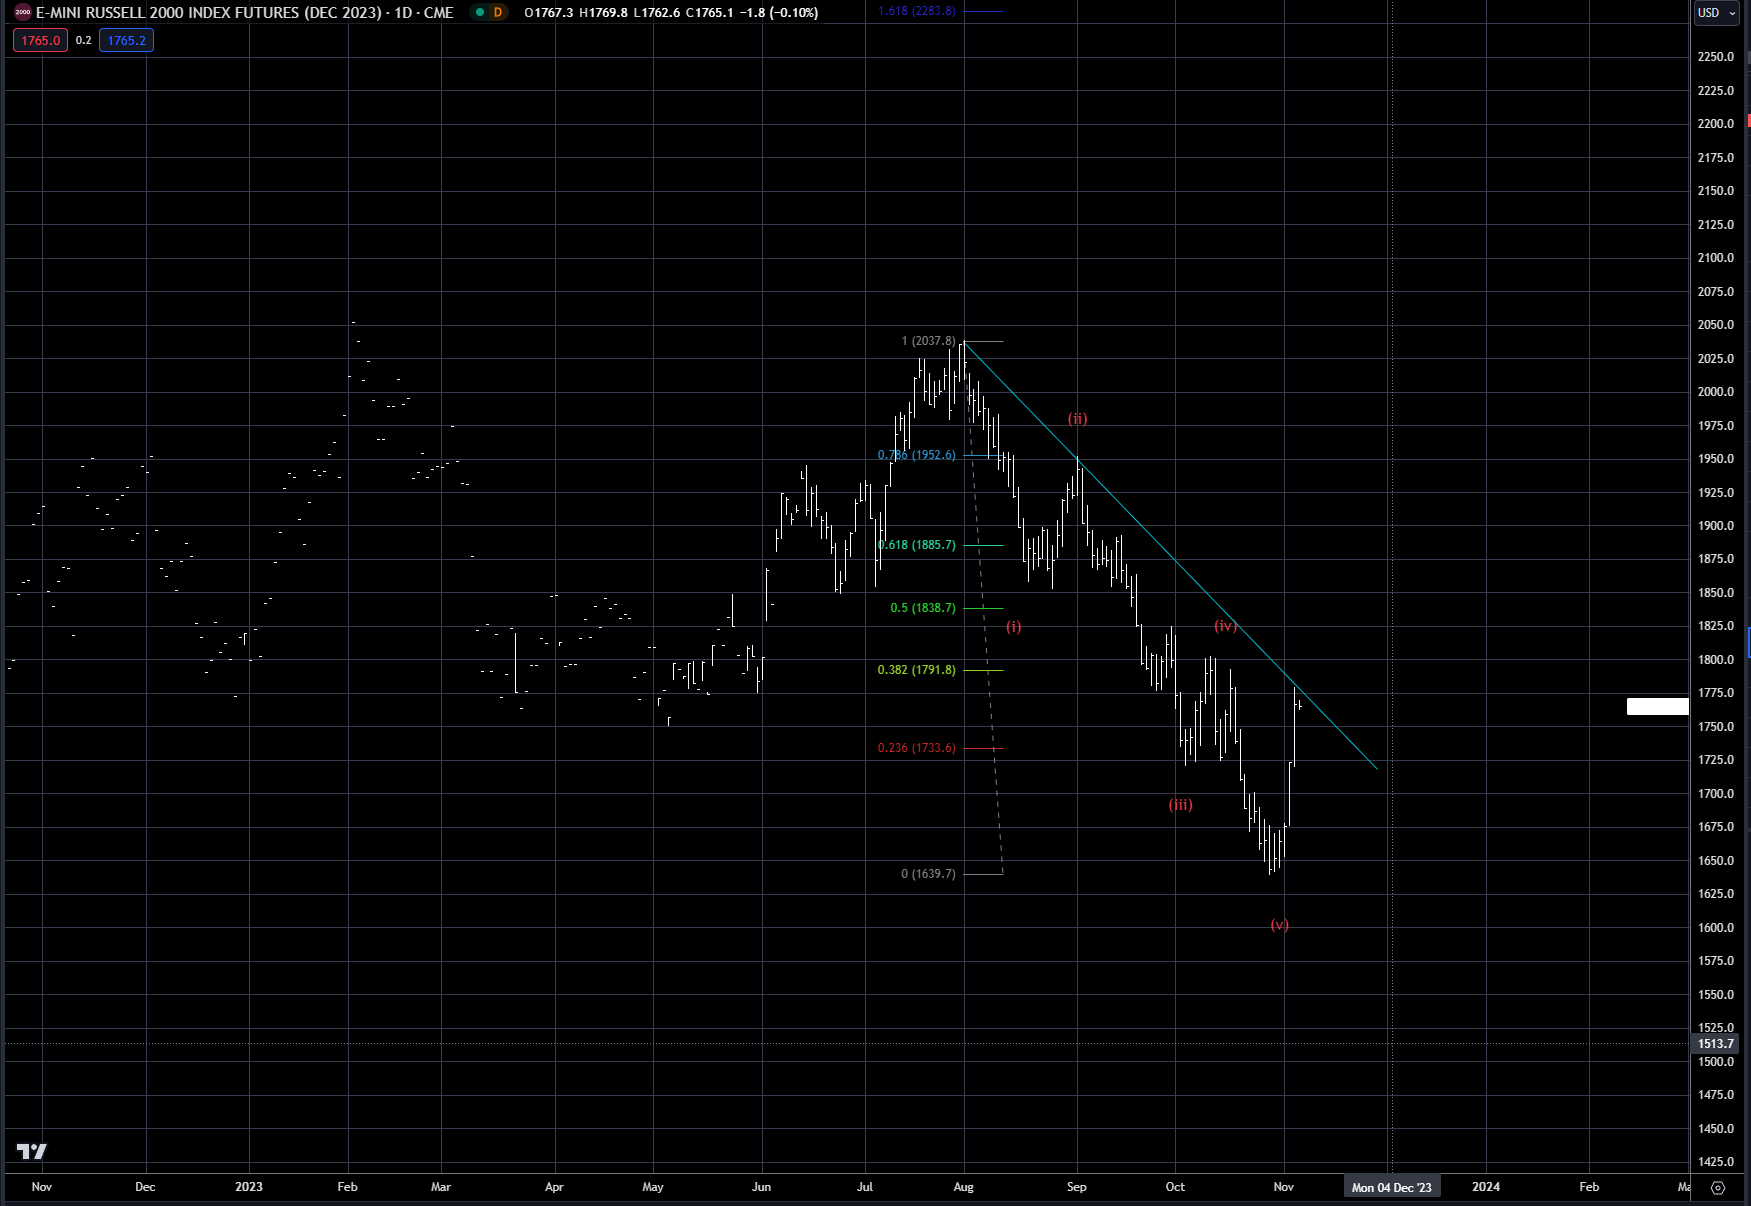
The Russell 200 was up almost 7.5% last week, and like the Nasdaq, has reached the downtrend line from the July highs. The 50% retracement level is still much higher - near the 1840 level. As discussed last week, small-cap stocks were quite cheap relative to the rest of the market, and had reached a very strong support area. Potential lower interest rates ahead really lit the buyer’s flame for the explosive rally on Thursday and Friday. But here again, this is most likely a buyer’s trap. Five wave moves down, as exhibited in this recent decline, are typically followed by a 50-62% corrective rally of the down move. For the next few weeks, the pattern that unfolds will indicate if we are in the early stages of a much bigger bear market.
Chart 1: Nasdaq 100 December 2023 futures contract

Chart 2: S&P500 December 2023 futures contract
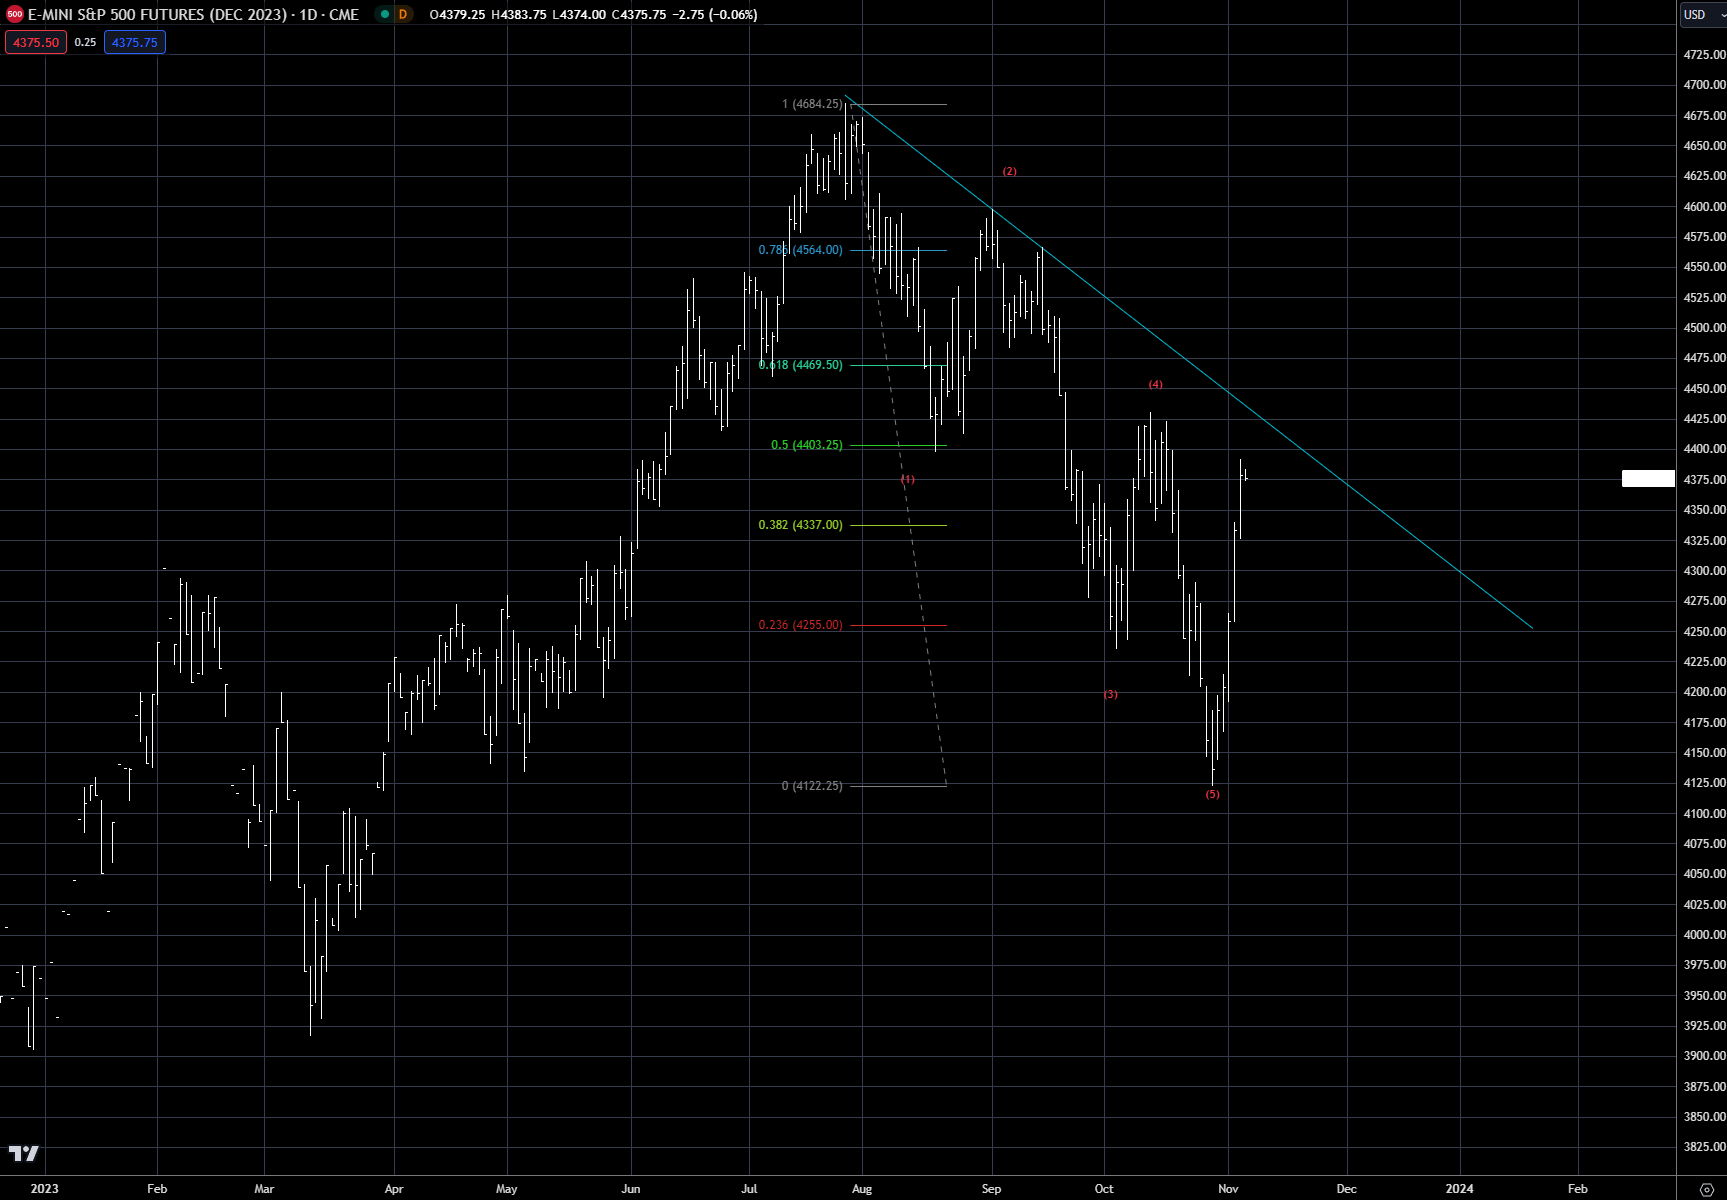
Chart 3: Russell 2000 December futures contract
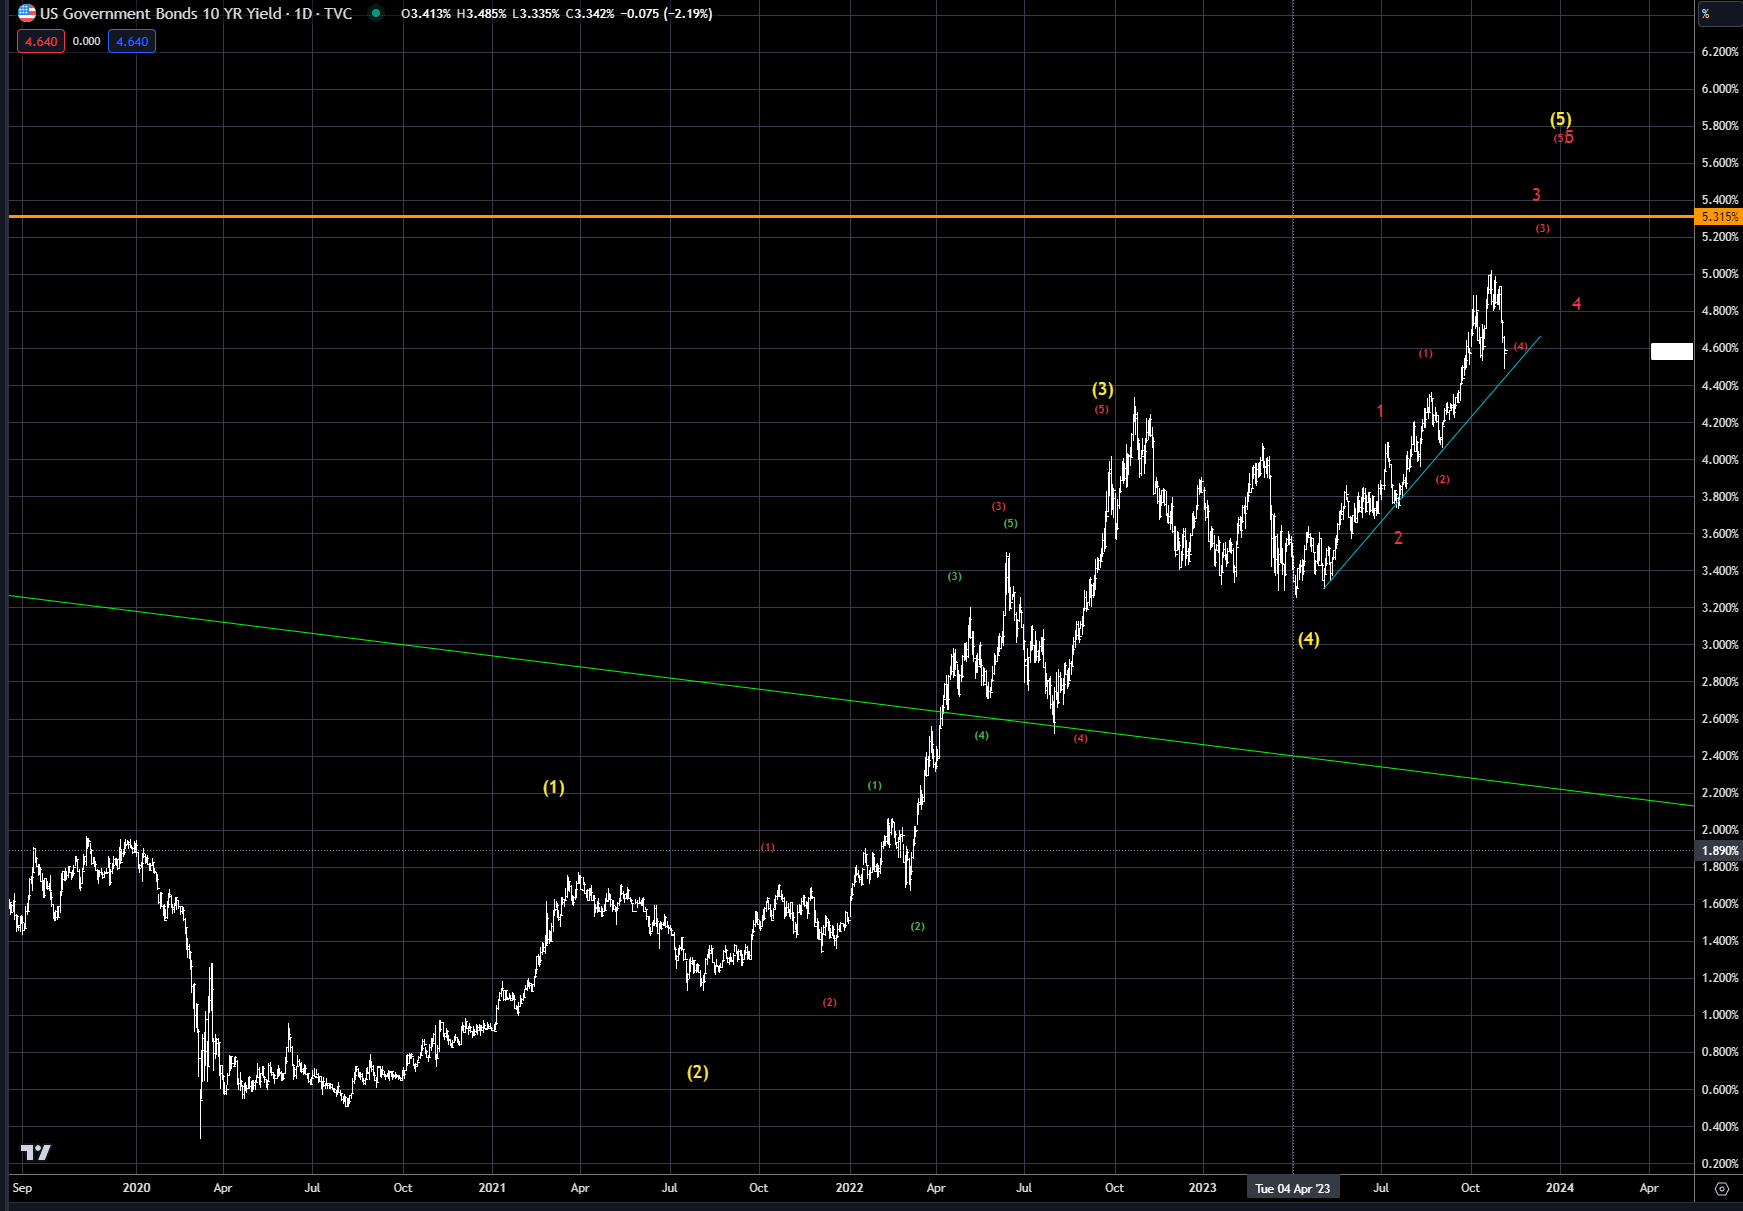
In the US bond market rates fell dramatically, with the US 10-year falling by almost 40 bps at one time last week, before settling around 4.57%. For the past month we have argued that the upside target was 4.50-5.00%, and that when the turn occurred it would be quite dramatic. Last week was quite dramatic - but was that the high in this move? Chart 4 shows the same chart that has been presented numerous times over the past six months.
In the short term, the pullback last week went right to the uptrend line from the April lows. I have labeled the possibility that there is still more upside before this rally is over - starting in 2020. For the next week or so, the 4.40% level will be quite key. This is near the trendline in blue and also represents the old highs from October 2022. The market should bounce off this level this week and give us some indication if more upside potential is there - or if that was the top near 5%.
Chart 4: US 10-year rate
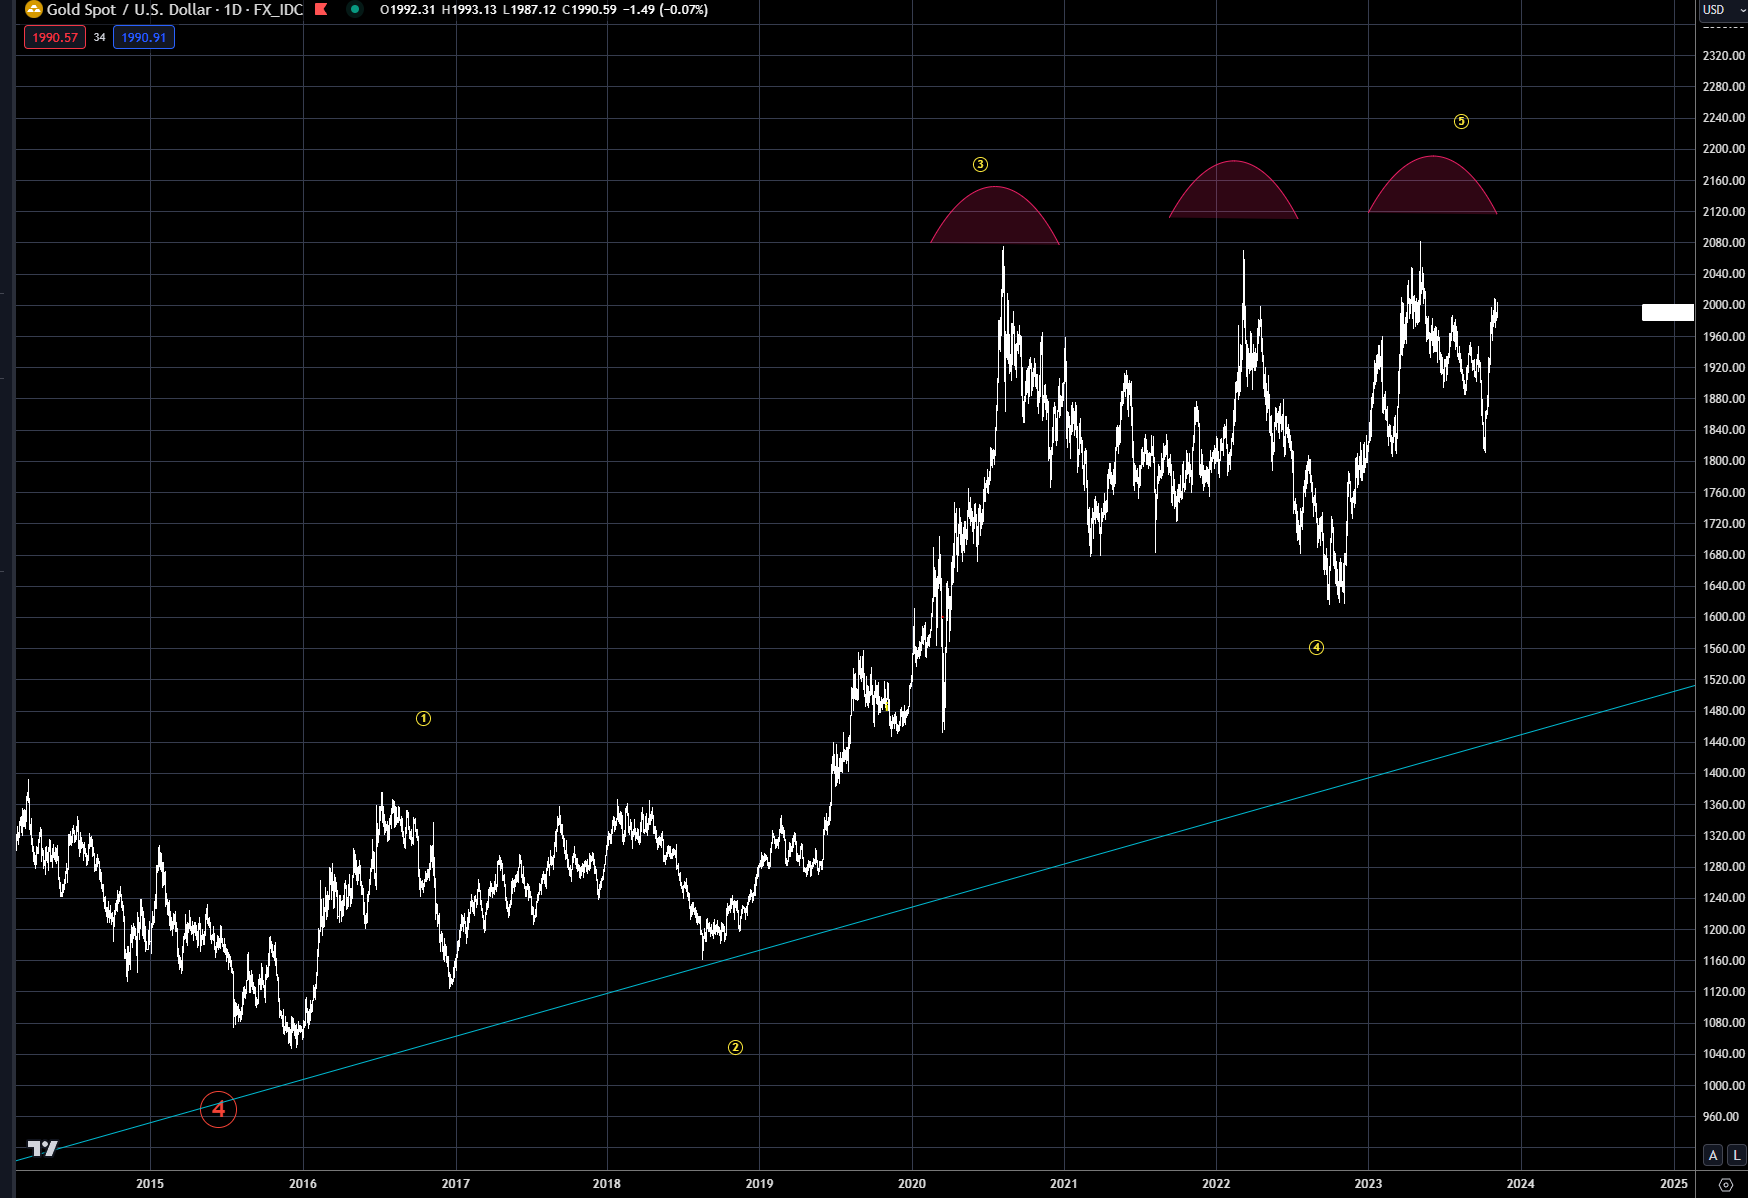
Gold was eerily quiet last week with the explosive move higher in equities and lower in interest rates. Surprisingly, gold was actually down last week, by about $14 an ounce, after a wild trading range on Friday. Now, gold had rallied almost $180 dollars over the previous four weeks, so maybe a break was due. But the big picture, as shown in Chart 5, is the large triple top overhanging the market. Even the conflict in the Middle East has not taken out this overhead resistance.
The market has now traded in this price range going on three years - a long time to hold a bullish view. The longer the price action stays in this trading pattern, the risks grow that a test of the blue trendline may occur, which would be a large correction. One could argue that this consolidation pattern is setting up for a move to all-time highs, but it may take a correction lower first.
It appears the price action last week may be setting up for a correction this coming week - look for a possible pullback over the next couple weeks.
Chart 5: Gold spot price
Trading strategy is based on the author's views and analysis as of the date of first publication. From time to time the author's views may change due to new information or evolving market conditions. Any major updates to the author's views will be published separately in the author's weekly commentary or a new deep dive.
This content is for educational purposes only and is NOT financial advice. Before acting on any information you must consult with your financial advisor.