A Look at S&P 500, Nasdaq and Nikkei
Author: Bruce Liegel
On May 31 this year, the weekly update warned about an imminent correction in the global equity markets. The call was a little early for both the S&P 500 and Nasdaq, but the rest of the global markets (except Japan) outlined in that report have traded sideways to lower since then. As of last Friday, the S&P 500 and Nasdaq have now traded below the close from May 30. While there is little technical significance about the 30th of May except the publication of the outlook, it is important to remember that the sharp move after the report for the following eight weeks has now reversed and all gains since have been erased.
Focusing first on the Nasdaq, the channel that had been discussed in prior reports has been broken decisively now, with the short-term trend now down. Our argument all along has been that the November 2021 highs market a very important top and the 2023 was by nature a corrective bounce.
In Chart 1, the 2021 level has been marked by the potential longer-term TOP, with the ensuing correction lower followed by the corrective bounce this year. The key level now is the orange horizontal line, indicating the best support for the market. While a potential rally could occur if this level holds, looking at other equity markets - to be discussed - the weakening internals are arguing against a strong rally, but a possible trading rally. For reference, I have labeled a possible wave 5 in red, which would complete the corrective phase from the 2022 lows. But for now, it's sit and wait and see how this correction unfolds over the next few weeks. There is a lot of data out this week, with the potential that all could be major market movers.
Chart 2 is the S&P 500 index, and is the first warning sign that the corrective bounce from the 2022 low appears now to be over. First, the trendline from the 2022 has been broken but, more importantly, the orange horizontal line representing the best support has been compromised. Note the difference between Nasdaq, which is still viable, versus the S&P 500, which is not - sometimes these subtle hints warn us about future impending declines in price.
The S&P 500 is now down about 12% from the July high and is getting short-term oversold - not a buying pattern at all, but a potential bounce may be in the cards.
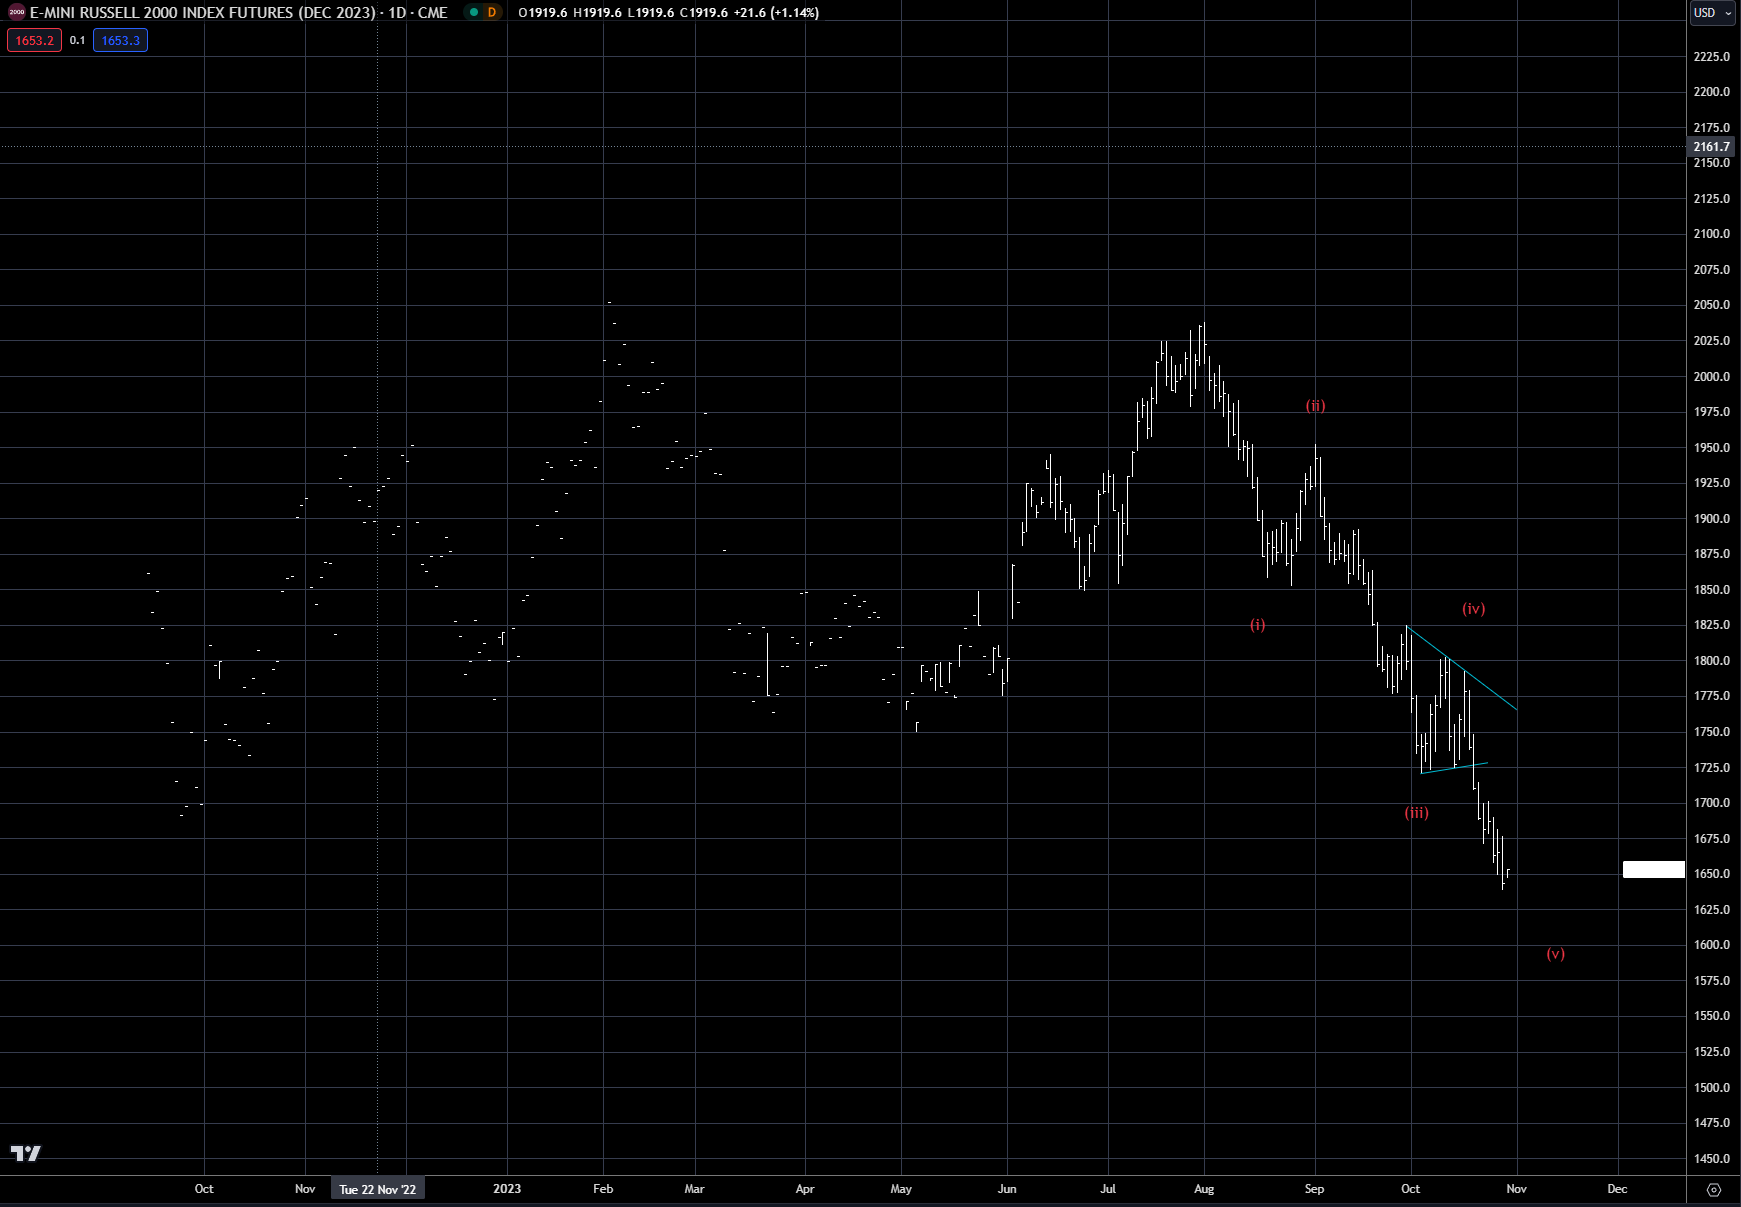
One argument that a bounce is getting close is the setup in the Russell 2000, shown in Chart 3. The Russell has been range-bound for the last year between 2000 on the high side and 1600 on the low side. The double green lines represent the best support, which are the old highs from 2018-2020 time period. The market has been digging into this area for the last couple years - in the long run the market will eventually take these lows out. Notice also the intersection between the blue trendline from the 2009 lows, with the green lows right near 1600. The combination of these two forces should support a bounce from here. Adding more evidence is Chart 4, which shows the 5-wave decline on the Russell December futures contract - targeting the 1600 level as a possible downside price target.
Chart 1: Nasdaq 100 index
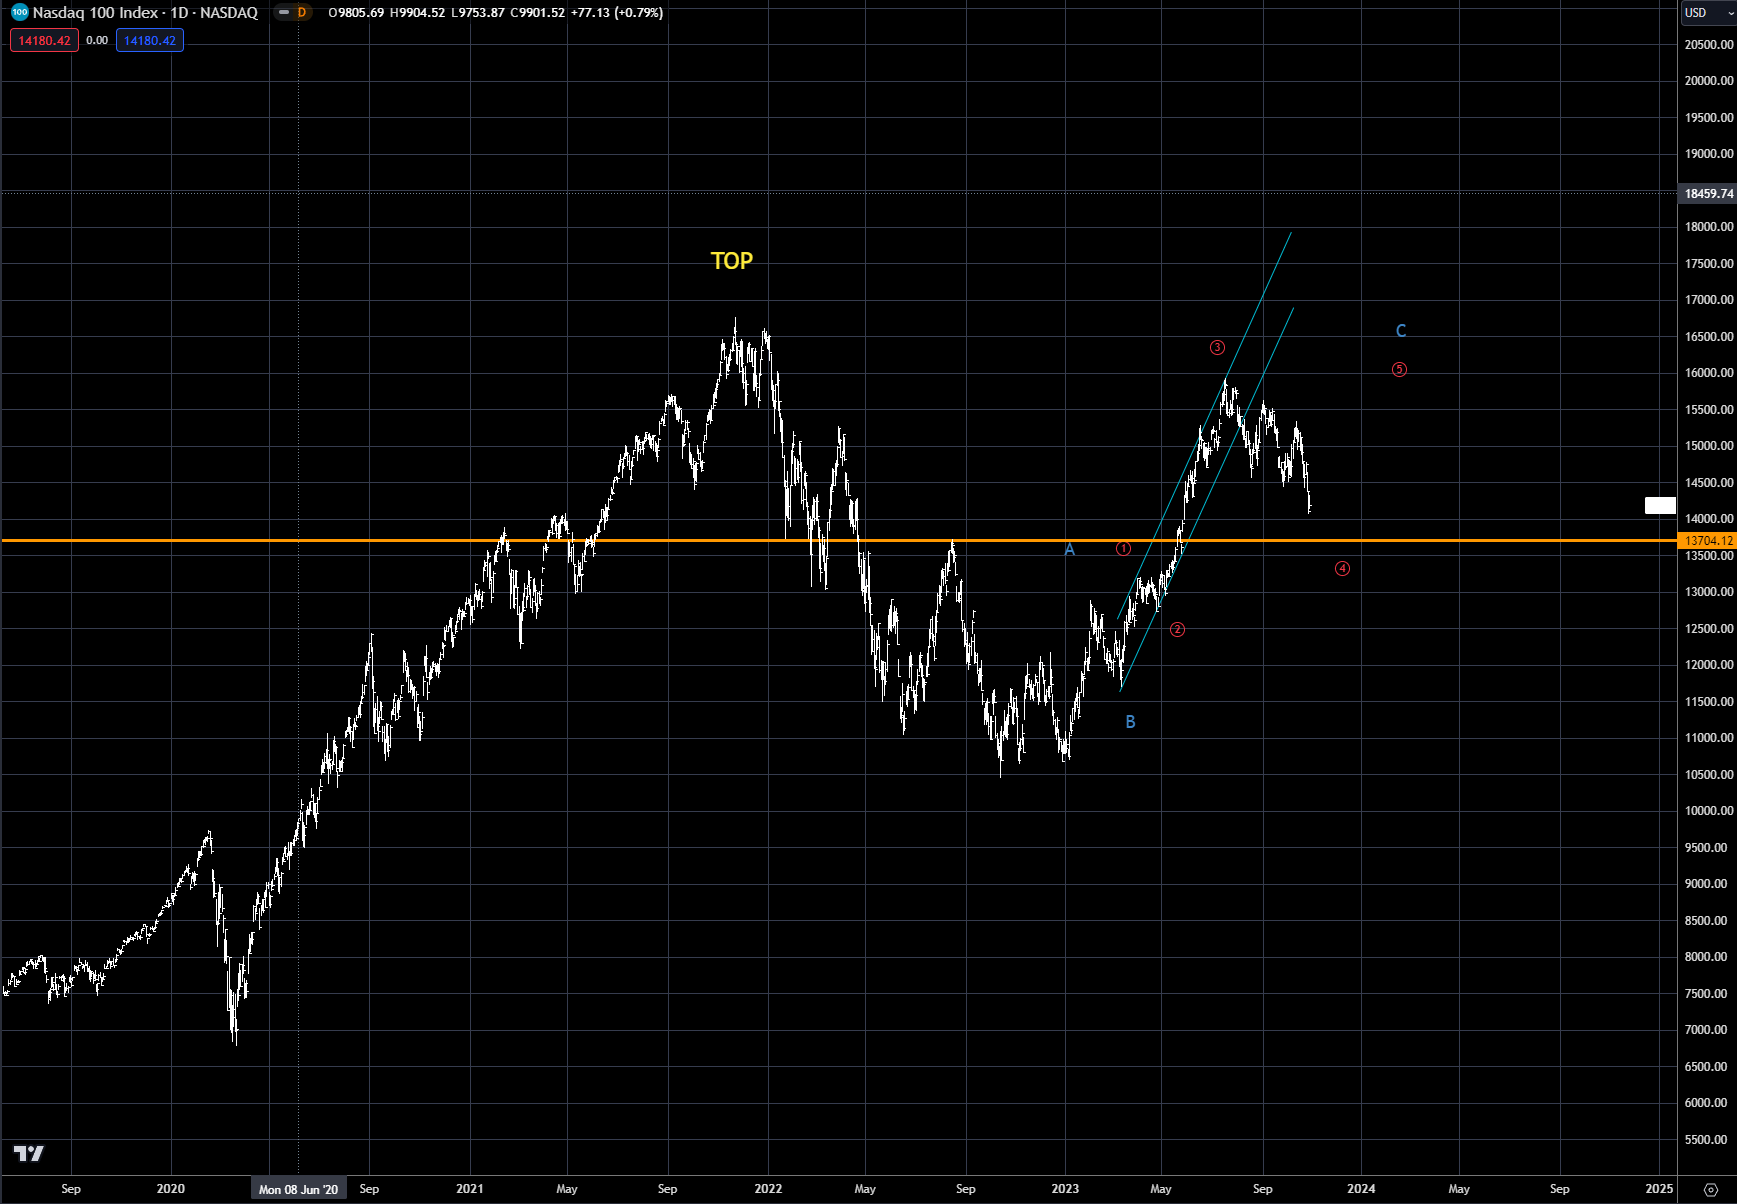
Chart 2: S&P 500 index
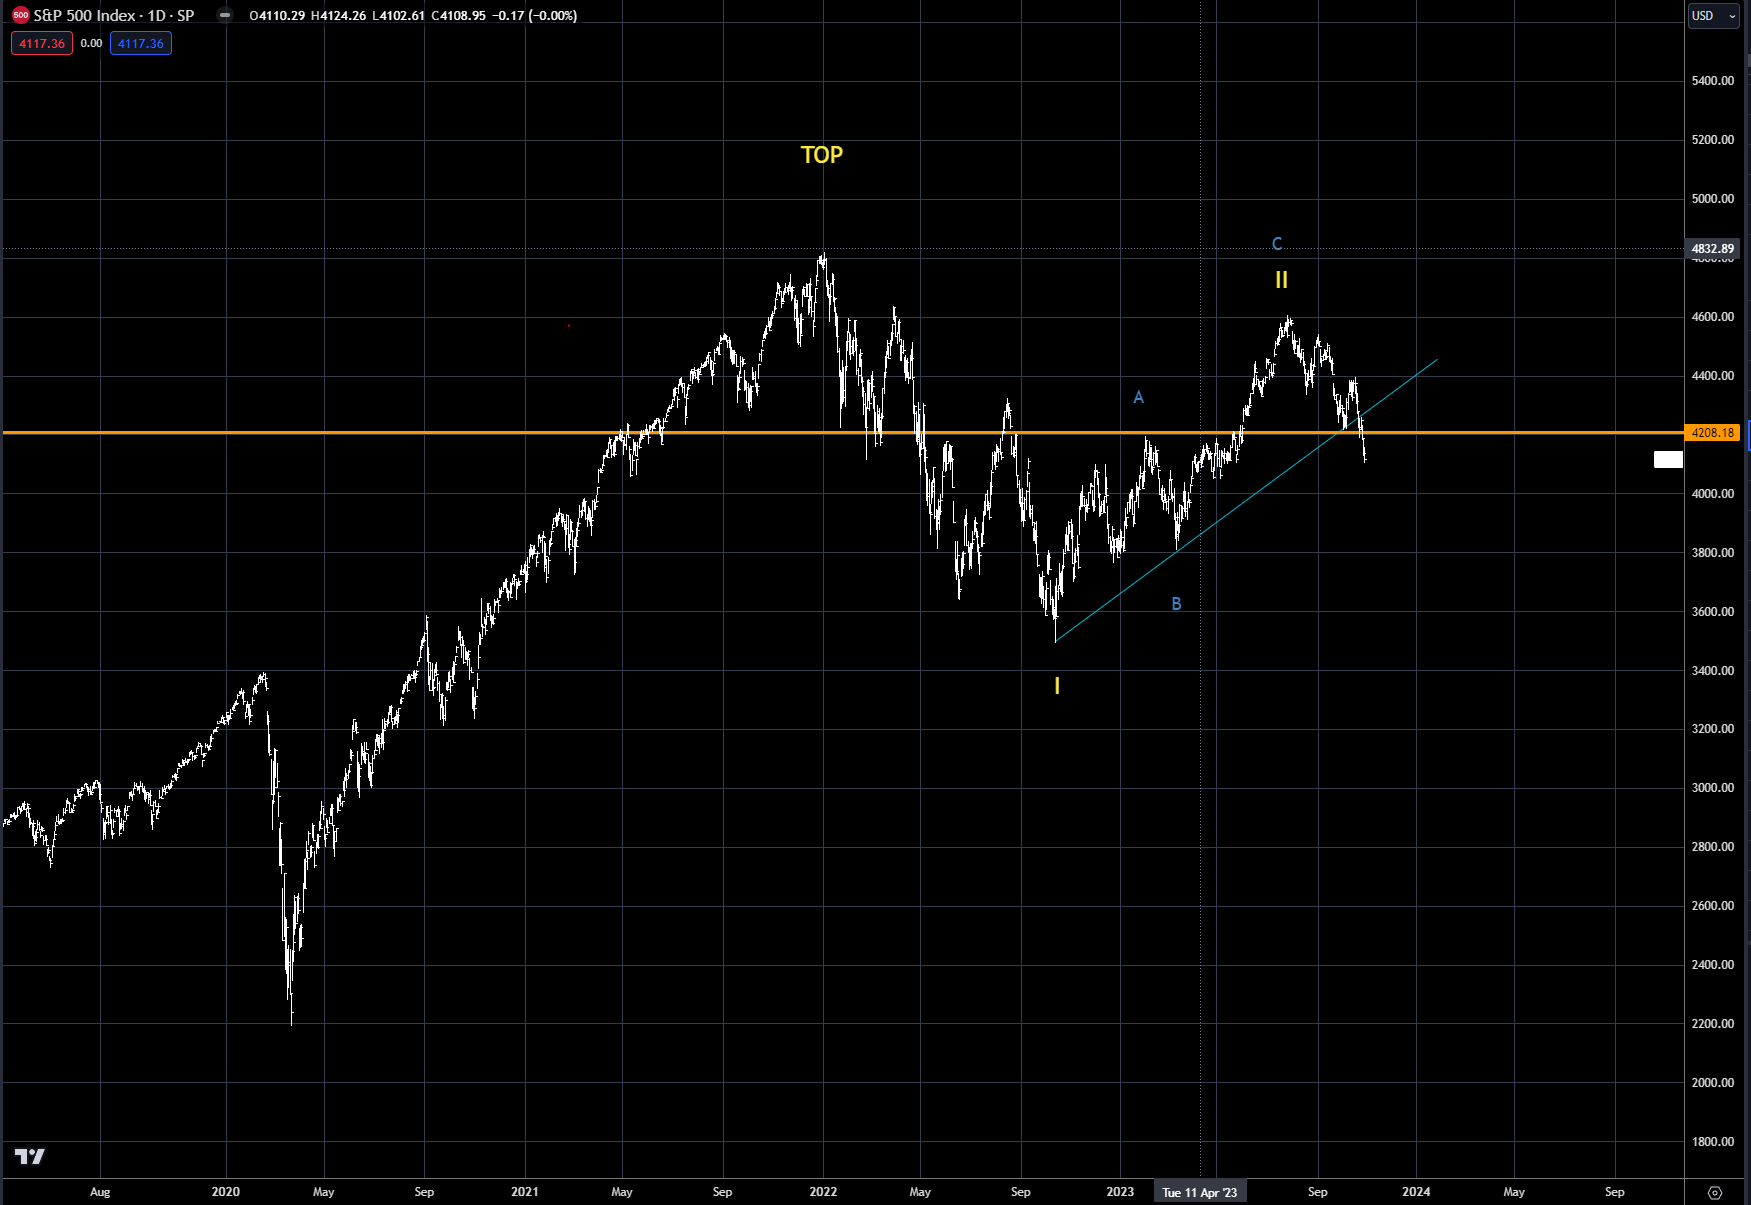
Chart 3: Russell 2000 index
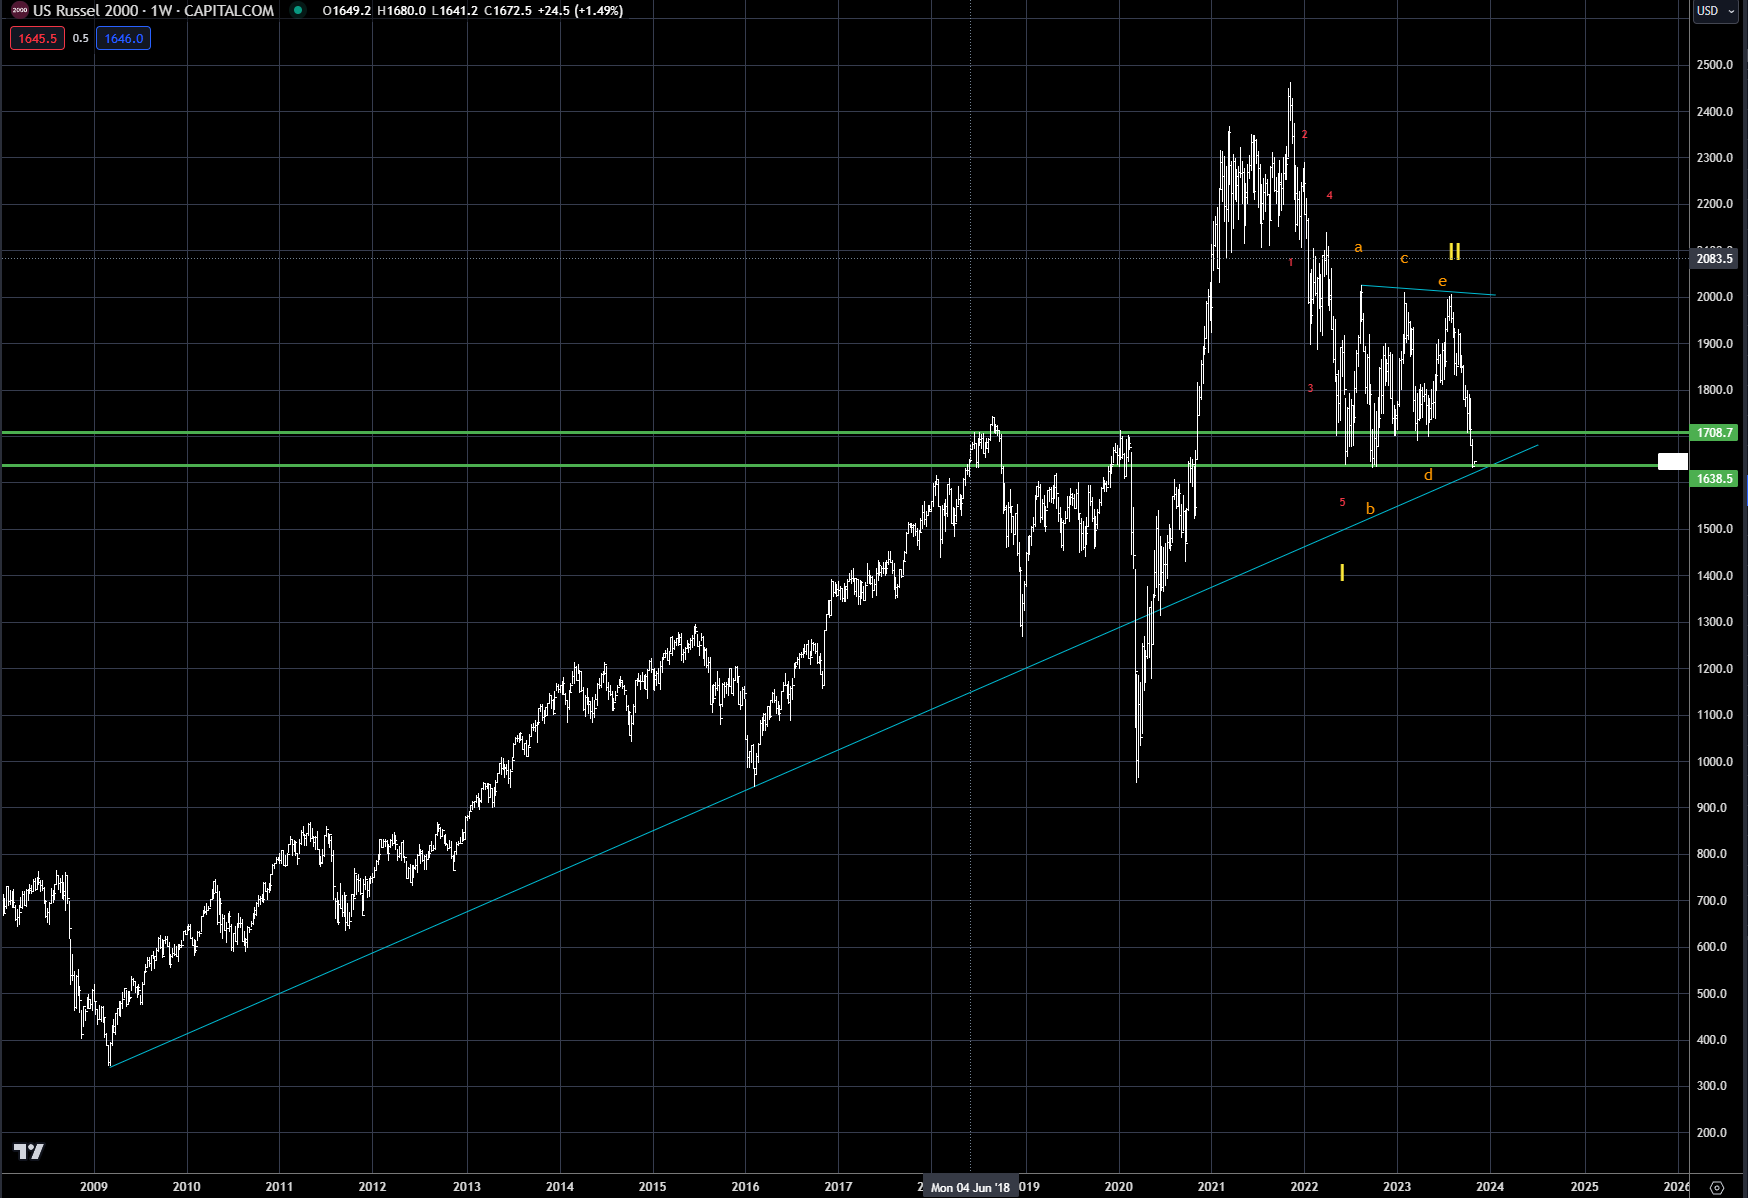
Chart 4: Russell 2023 December futures contract
On a relative basis, the S&P 500 is quite rich versus the Russell 2000, as shown in Chart 5 - with small-cap stocks getting crushed from the Federal Reserve rate tightening. But really this story has been going on since the market bottom in 2009, led by the huge outperformance by the tech sector. The FANNG stocks - the publicly traded stocks of U.S. technology giants Facebook, Amazon, Apple, Netflix, and Google - have had an amazing run since the GFC in 2008.
If an investor believes that tech is about ready to end its dominance and the Fed will being easing, small cap stocks could offer a unique arbitrage.
Chart 6 shows the explosive move in large-cap growth via the Vanguard ETF -VUG versus the small-cap growth via Vanguard ETF -VBK. The spread has really accelerated since 2021, with the continued surge in the top five large-cap tech stocks.
Japanese Nikkei
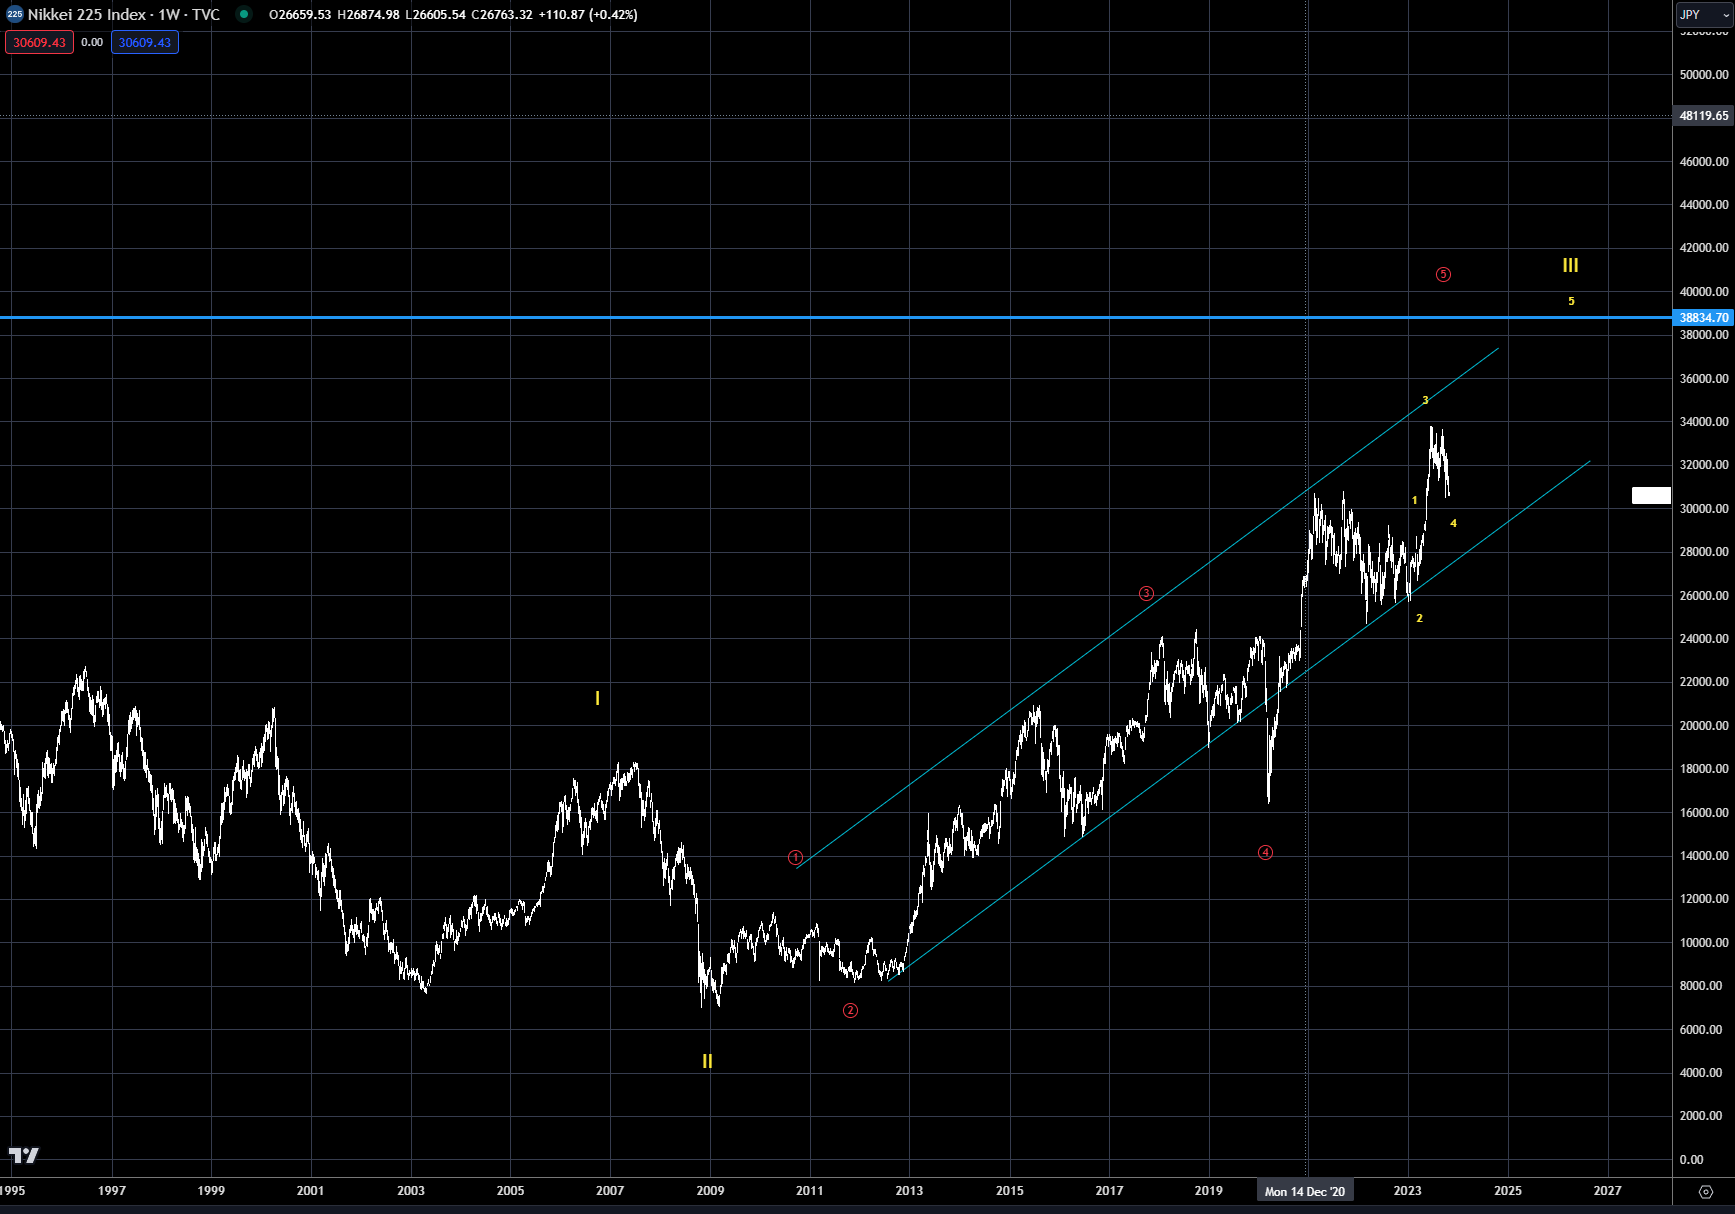
The outlook for the Japanese Nikkei 225 continues to appear to be quite strong - we have been arguing that the market will test the all-time highs this year, possibly early next. See our deep dive on Japan from September 13 for more info.
Chart 7 shows the Nikkei chart, with the distinct channel still in place - remember, in the US the channel has broken down. The horizontal blue line represents the all-time highs from 1990, and is the upside target level.
The overall trend from the 2009 low continues to be quite strong, with market dips still possible buying opportunities for now.
Chart 5: S&P 500 index (SPX) – Russell 2000 (RTY)
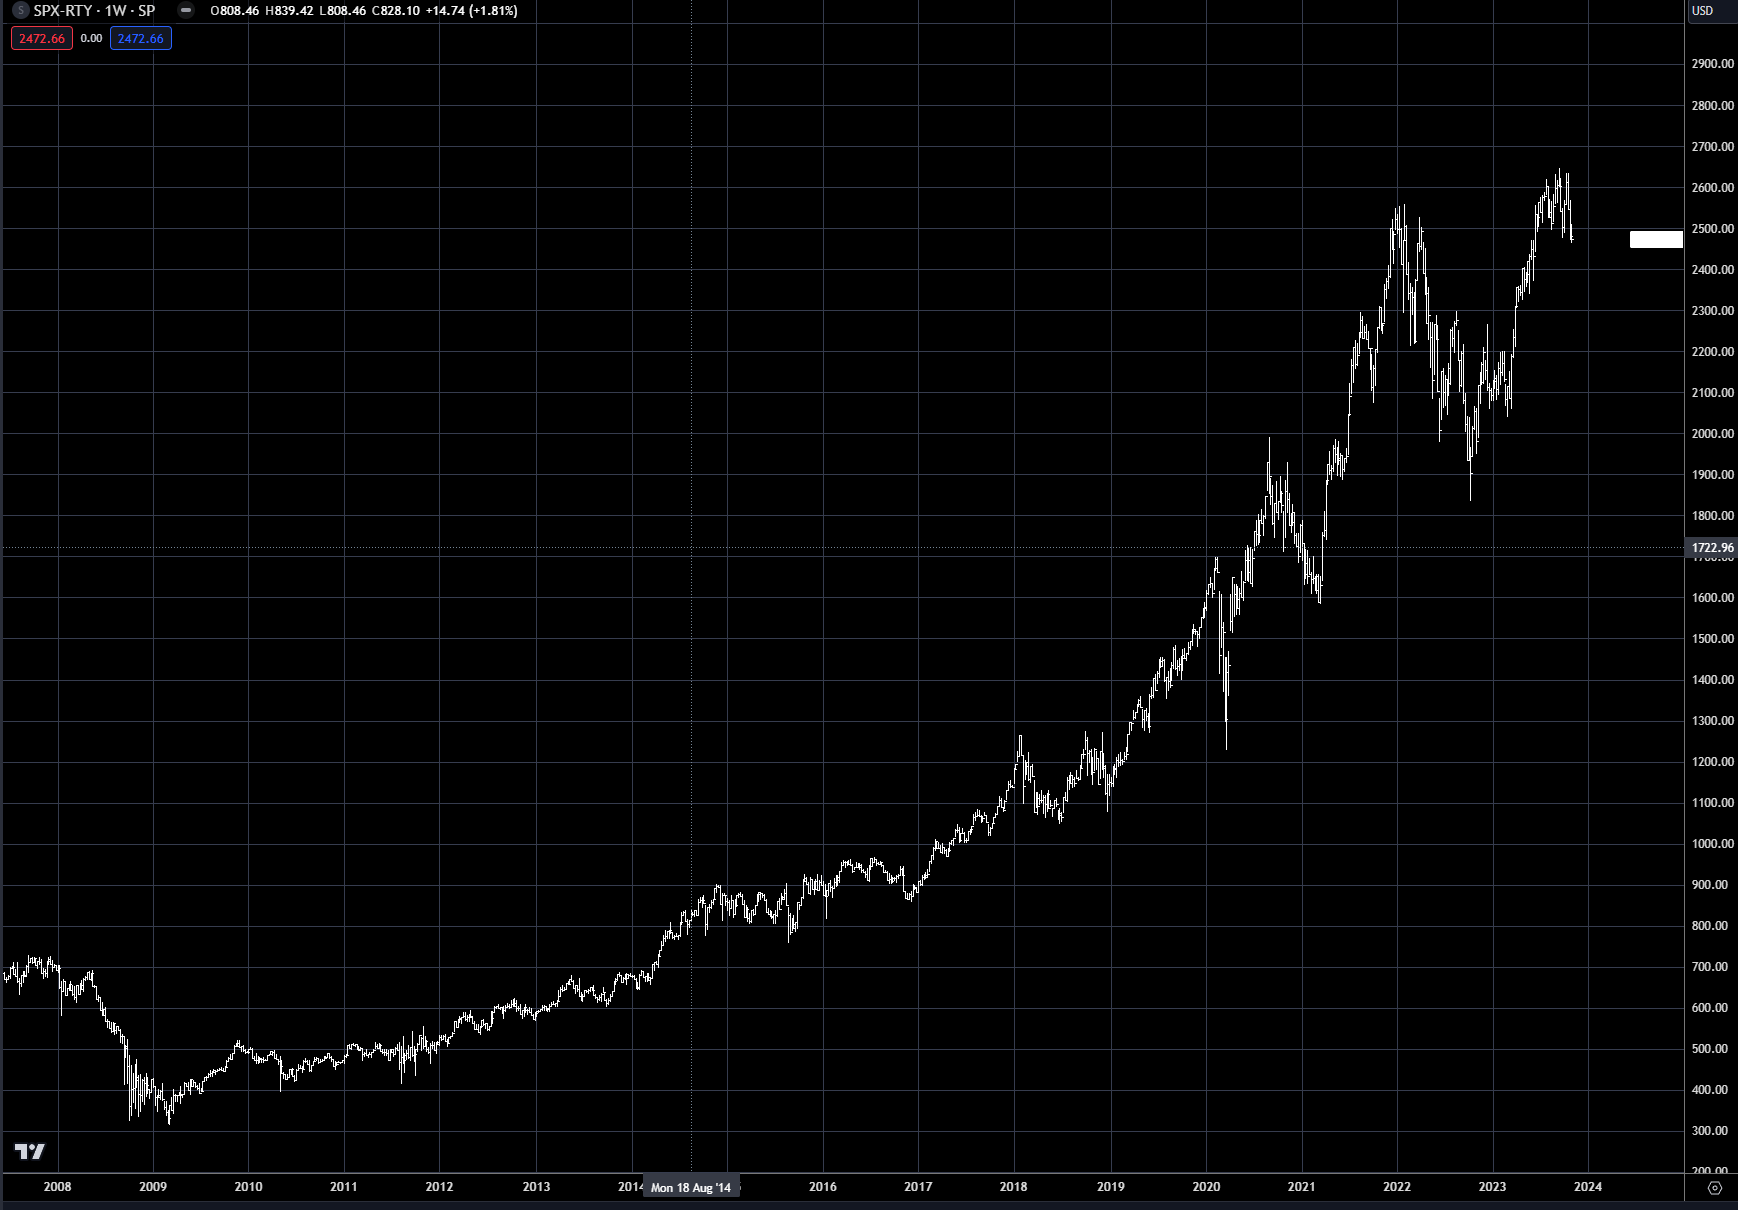
Chart 6: Large-cap growth (VUG) – small-cap growth (VBK)
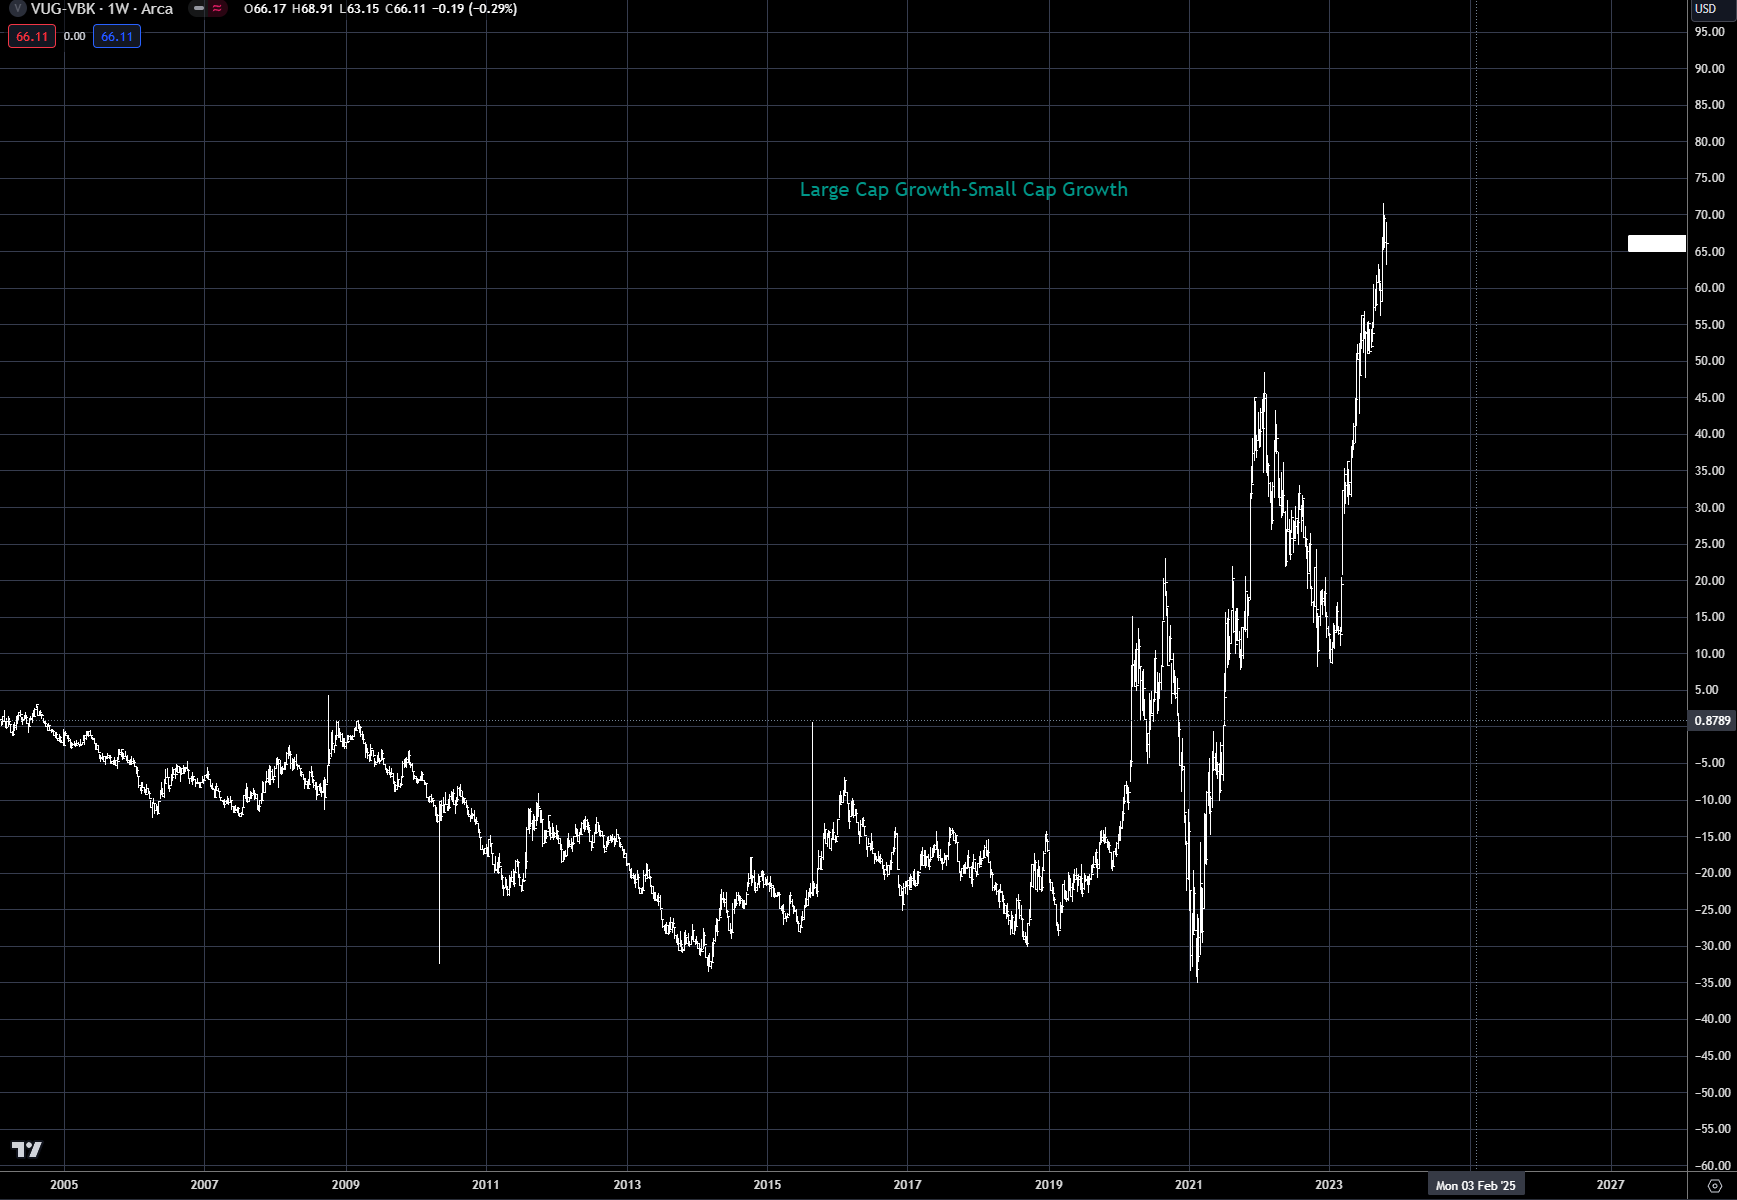
Chart 7: Nikkei 225 index
Trading strategy is based on the author's views and analysis as of the date of first publication. From time to time the author's views may change due to new information or evolving market conditions. Any major updates to the author's views will be published separately in the author's weekly commentary or a new deep dive.
This content is for educational purposes only and is NOT financial advice. Before acting on any information you must consult with your financial advisor.