2024 Interest Rate Outlook
Author: Bruce Liegel
Over the past three years, US interest rates have increased by the greatest amount in over 50 years, rising from near zero to over 5%. The first stage of the bull market in higher rates is now complete, indicating that over the next 12-18 months, interest rates will likely trade within a large range, with 5% on the high side and 2.50-3.50% on the low side. At the end of 2023, the market was pricing in 100-150 basis points (bps) of rate cuts for 2024, and as Chart 1 shows, almost two-thirds of institutional money managers expect interest rates to fall this year. This all seems reasonable as the economy continues to slow down—whether that's looking at ISM data or employment job growth. The question is: has the market gotten ahead of itself by pricing in too many Federal Reserve easings for 2024?
Chart 1
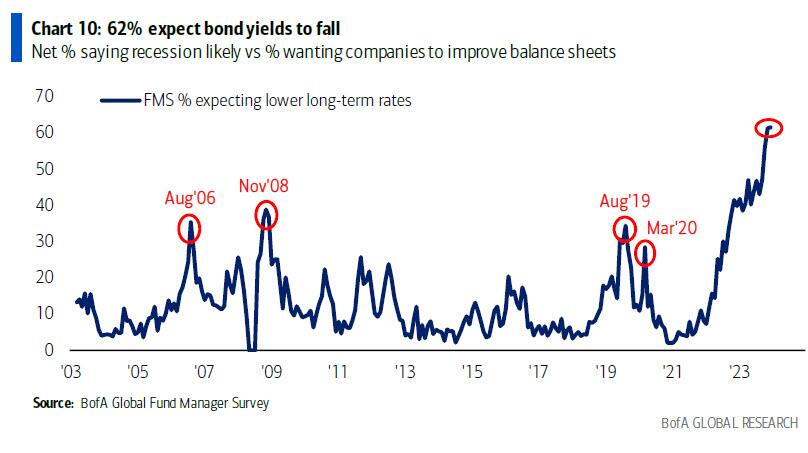
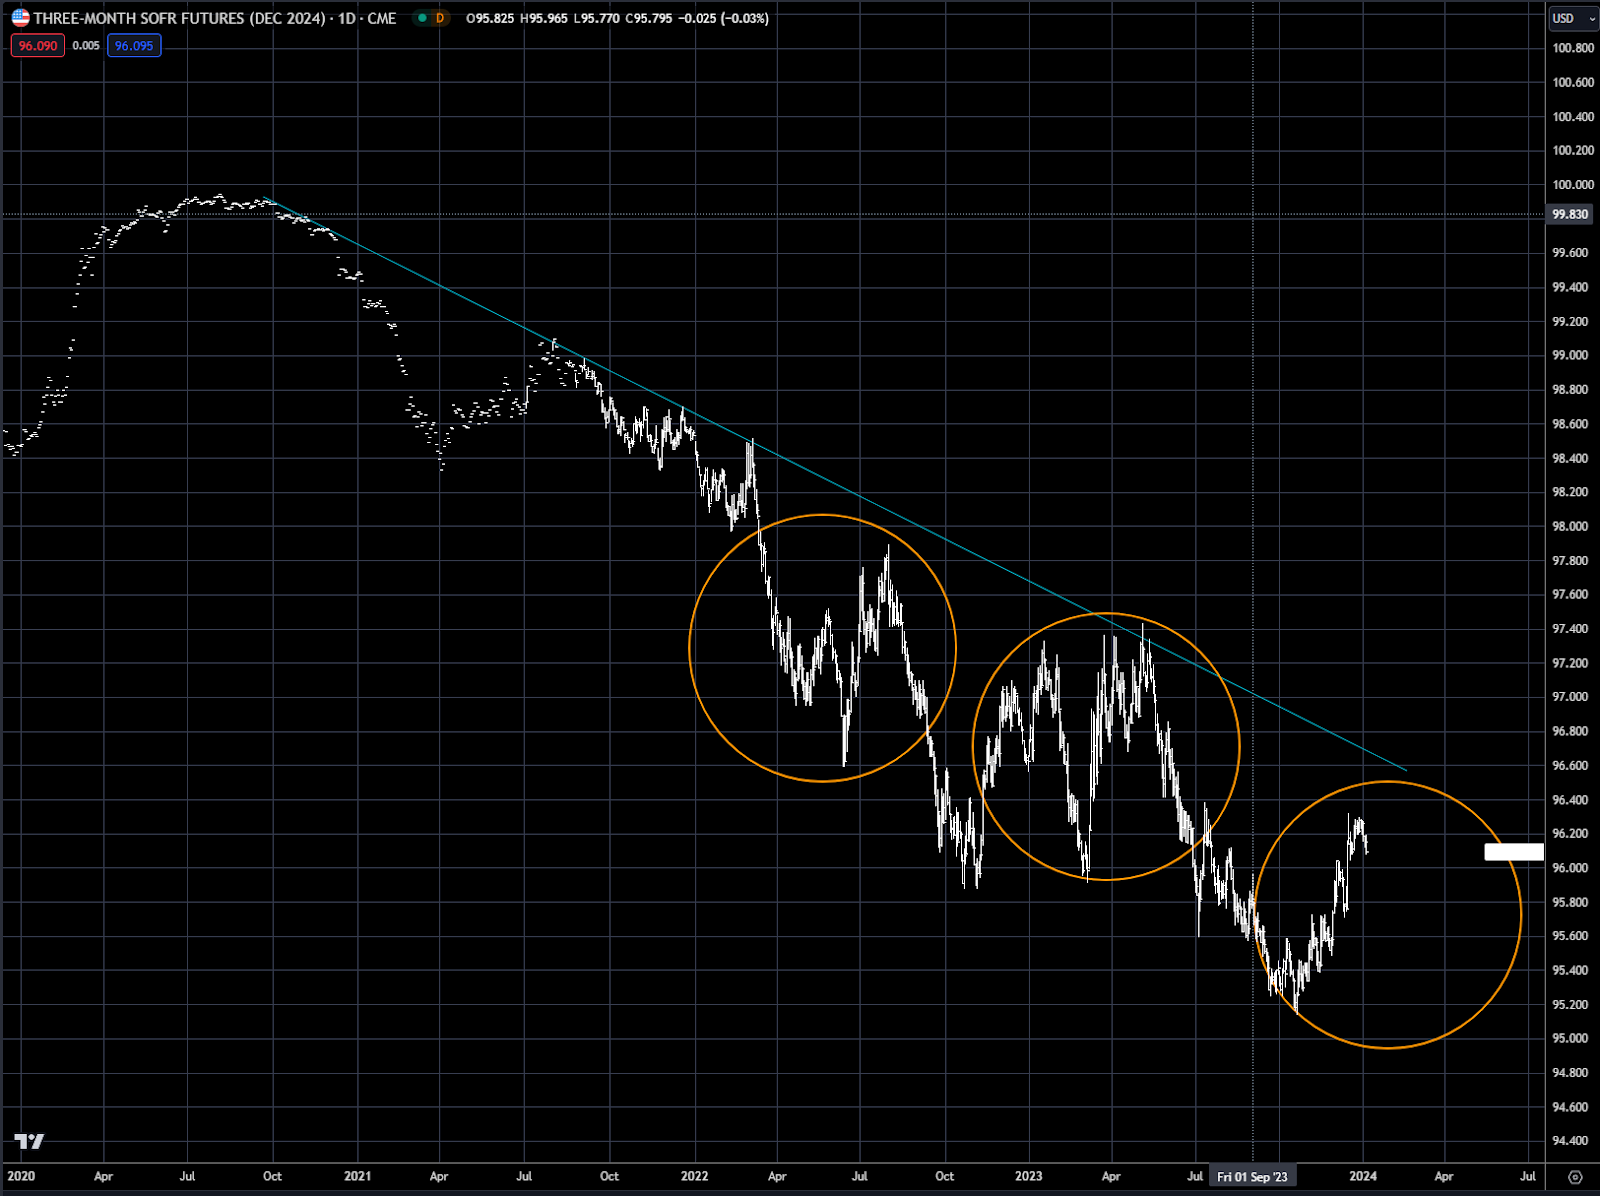
Chart 2 shows the Secured Overnight Financing Rate (SOFR) using the December 2024 future. SOFR replaced LIBOR last year as the benchmark for setting market interest rates. As you can see, the market has misjudged the Fed several times over the past year, as indicated by the sharp rallies in the documented circles. The current rally is highlighted by the last circle on the chart. The downtrend line is expected to provide strong resistance in the short term, potentially near 96.60, halting any further declines in rates.
Chart 2 SOFR--Secured Overnight Financing Rate (Dec 2024)
Data dependency will continue to be a key driver for central banks, potentially leading to increased market volatility. The VIX, which is currently trading below 13%, seems oblivious to this potential volatility, as it is near the lower end of its 25-year range (see Chart 3). Volatility is cheap – meaning a sharp reaction to negative data release could cause larger swings in the market on data event days.
Chart 3 CBOE S&P 500 Index Volatility

Chart 4 shows the 10-yr yield, a topic we've frequently referenced over the past year, with the clear breakout of the long-term trendline from the 1980 high. But as mentioned earlier, the first leg up in interest rates is now complete – indicated by the 5-wave count on Chart 3. This argues for a protracted period of sideways to downward movement in interest rates for the balance of 2024 and potential 2025. Yes, the corrective move could span multiple years, highlighting the challenge of analyzing 50-year charts: it takes time and patience.
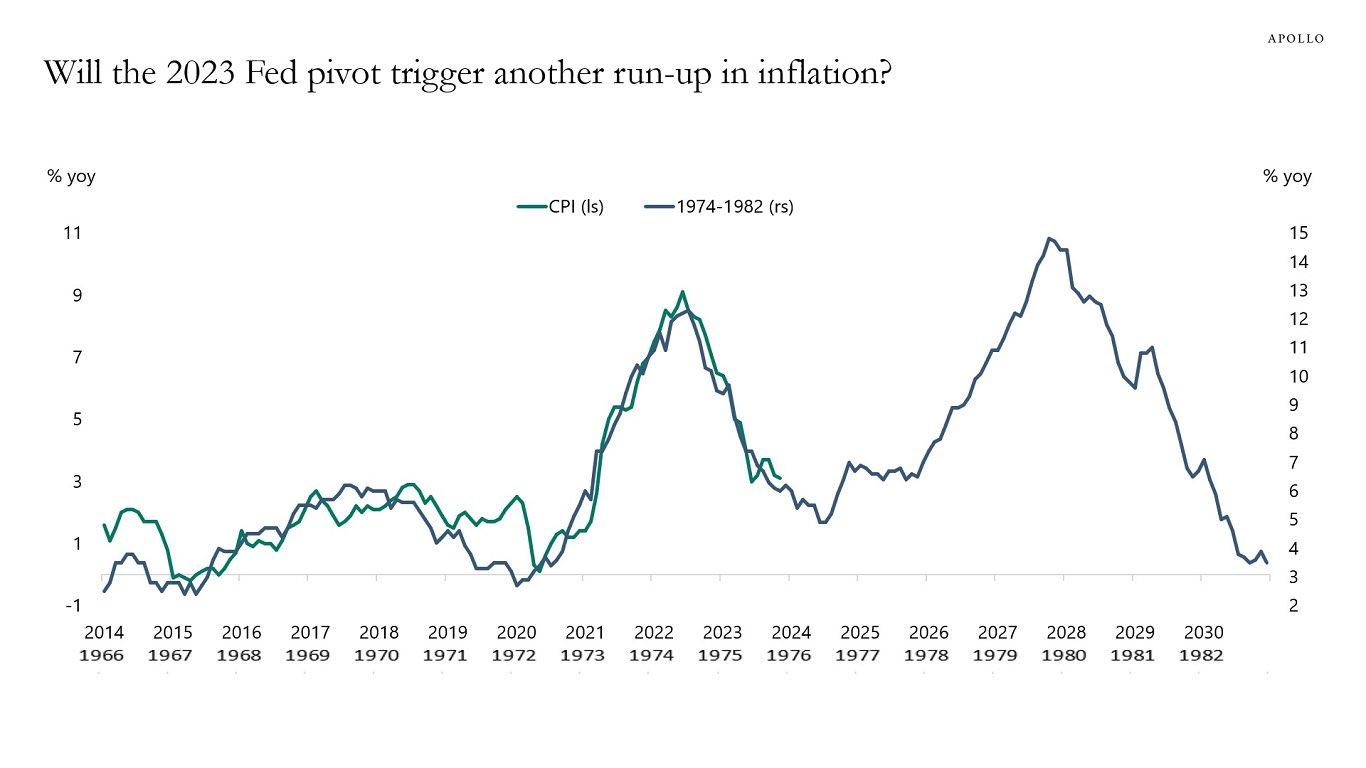
There have been numerous comparisons with today’s market action and that from the 1970’s. Chart 5 shows the inflation overlay comparing the 1970’s with the current period, a comparison we have often made here. So far the overlay has been spot on, suggesting a sideways trend for the next 2-3 years, with some volatility."
Chart 4 US 10yr rate

Chart 5 1970-1980 comparison with 2020’s
Real interest rates (inflation minus nominal interest rates) are what drives the market. Comparing today's real rates with those of the 1970s is a good way to square the circle on the overlay comparison. In Chart 6, the 10-yr real rate is shown back over 50 years. The orange circle shows the volatile price action from the 1970’s, prior to inflation exploding higher, dragging real rates along with it circa 1979-1980.
Should we follow a similar trajectory as in the 1970s, real rates are likely to decline dramatically over the next 2 years as the Fed cuts rates and inflation stays near the 2-3% target range. This decrease in real rates might further inflate the asset bubble — which is a whole other issue. What is different this time is the Fed’s reluctance to repeat the mistakes of the 1970’s, possibly keeping rates tighter than normal earlier in this cycle, which could cause more harm to the economy. This is the box that central banks have now got themselves into: too much debt creation and asset bubbles leave them with the possibility that the whole system is at risk. Achieving a 'soft landing' may not be as straightforward as some commentators suggest.
Chart 6 US 10 year real rate

Heading into 2024 and beyond there is a refinancing overhang that will be impacting interest rate markets in commercial real estate (CRE), corporate debt refinancings and US government debt – in effect putting in a floor, as demand for refinancing will be quite strong. This crowding out effect should limit the amount that rates are able to move lower. The alternative to this for the past 25 years has been central bank printing — the risk going forward now is more monetization will stir up inflation causing a repeat of the past couple years.
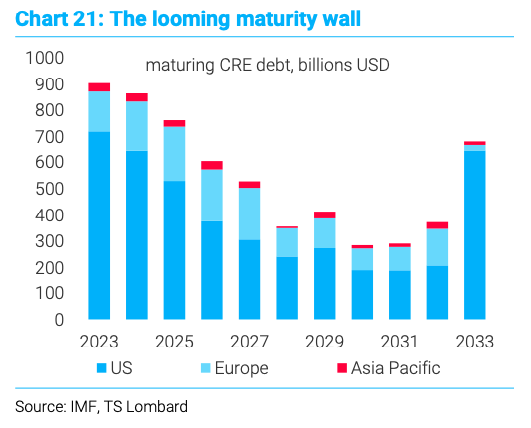
Chart 7 shows the dollar amount of debt that needs to be refinanced in the CRE space—this began in 2023, but will continue for the next 2-3 years. The higher rate on refinancings, will have a dramatic impact on the profitability for assets like office and retail space.
Chart 7
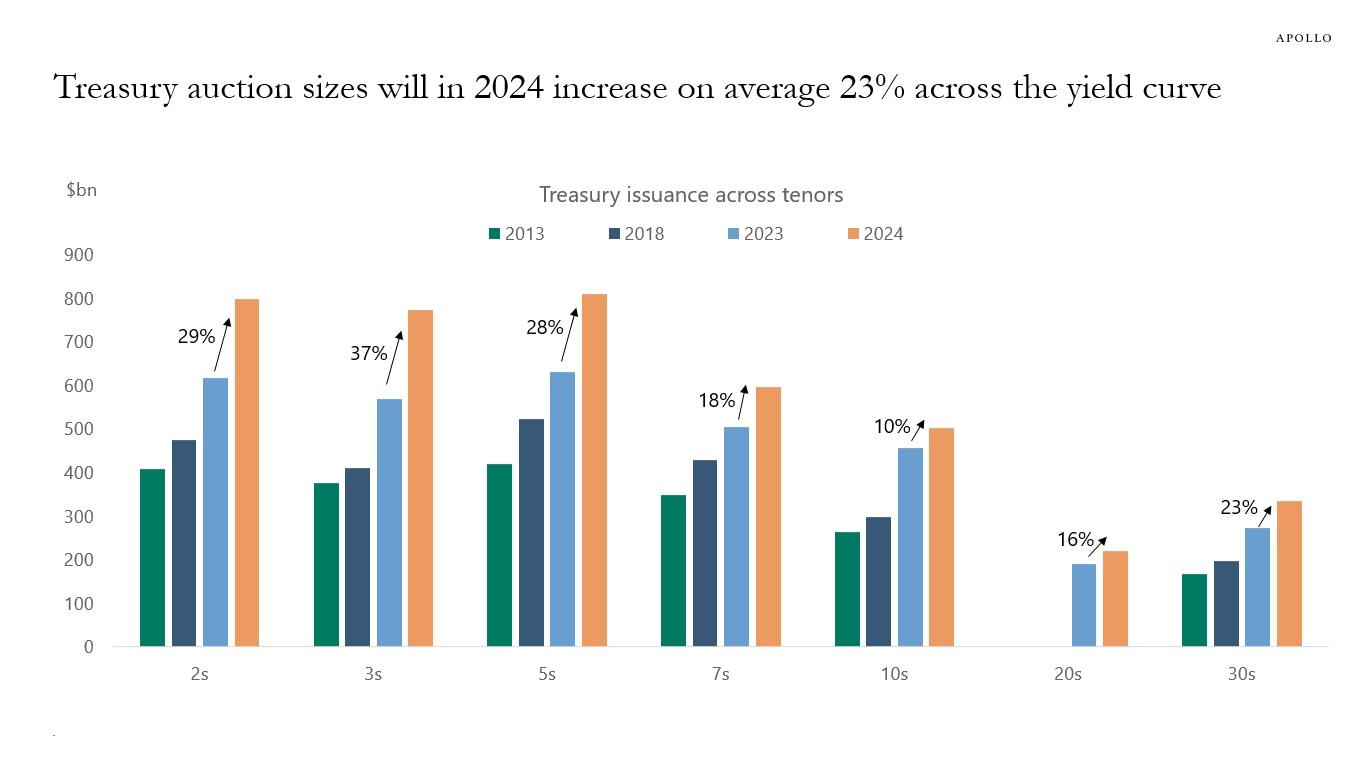
The corporate sector will also see a dramatic impact on refinancing as shown in Chart 8, with investment grade debt being the largest component. And finally, Chart 9 shows the large increase in US Treasury auctions for 20024, up 23% across the curve.
Chart 8
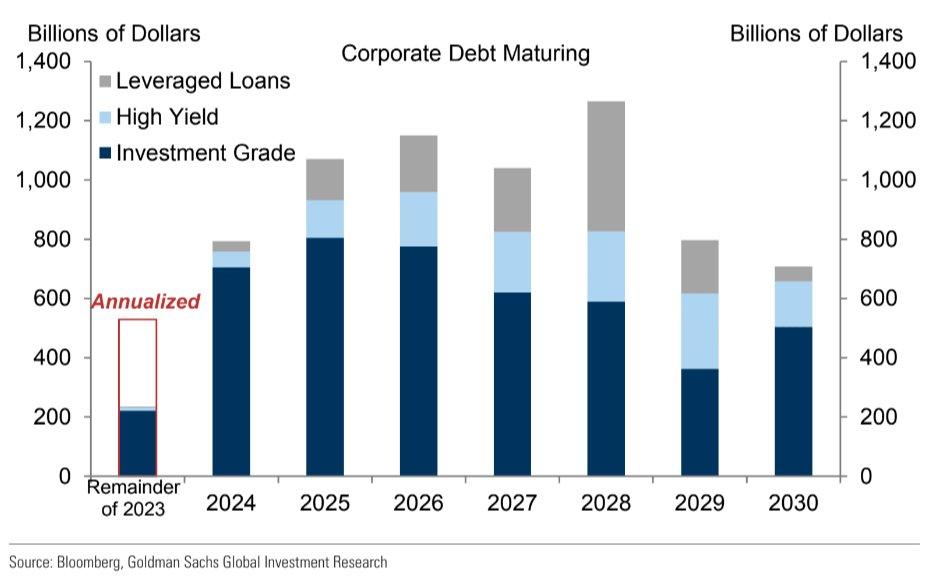
Chart 9
Over the last 25 years global interest rates have been quite correlated, especially in the G7. Chart 10 shows the 10yr interest rates for Australia, US, Great Britain, Canada and Germany. While the level of interest rates are obviously not the same, the main direction or movements have been very similar. Even Japan with its longer than normal zero interest rate policy, has seen the direction of their interest rates follow the global trend (Chart 11).
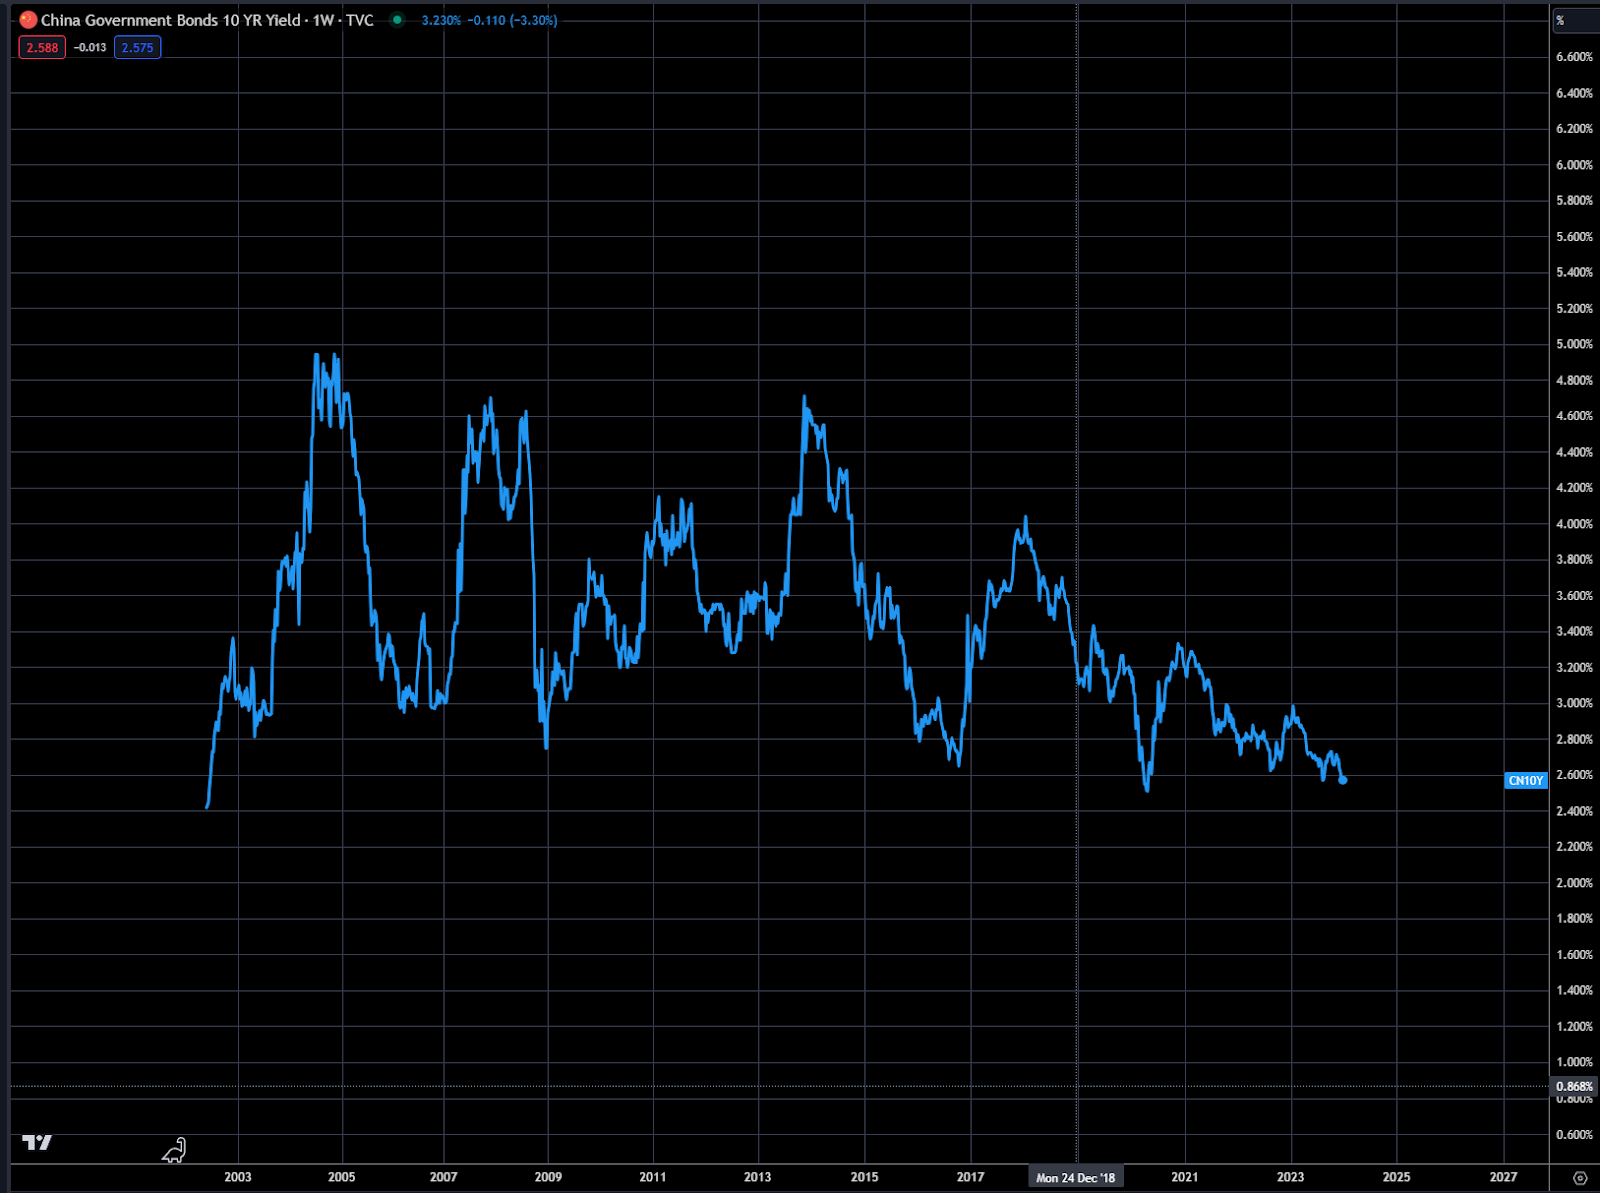
China has been the one dominant country that has run its own interest rate policy outside the global central banks. This has been especially obvious the past three years as Chinese rates have moved lower, as their countries growth slowed dramatically, especially in real estate. Chart 12 shows the Chinese 10yr rate. Going forward Chinese rate policy will most likely be aligned with the global central banks, as global growth slows, following China’s slowdown.
Chart 10 Global interest rates—10yr

Chart 11 Japanese 10yr rate
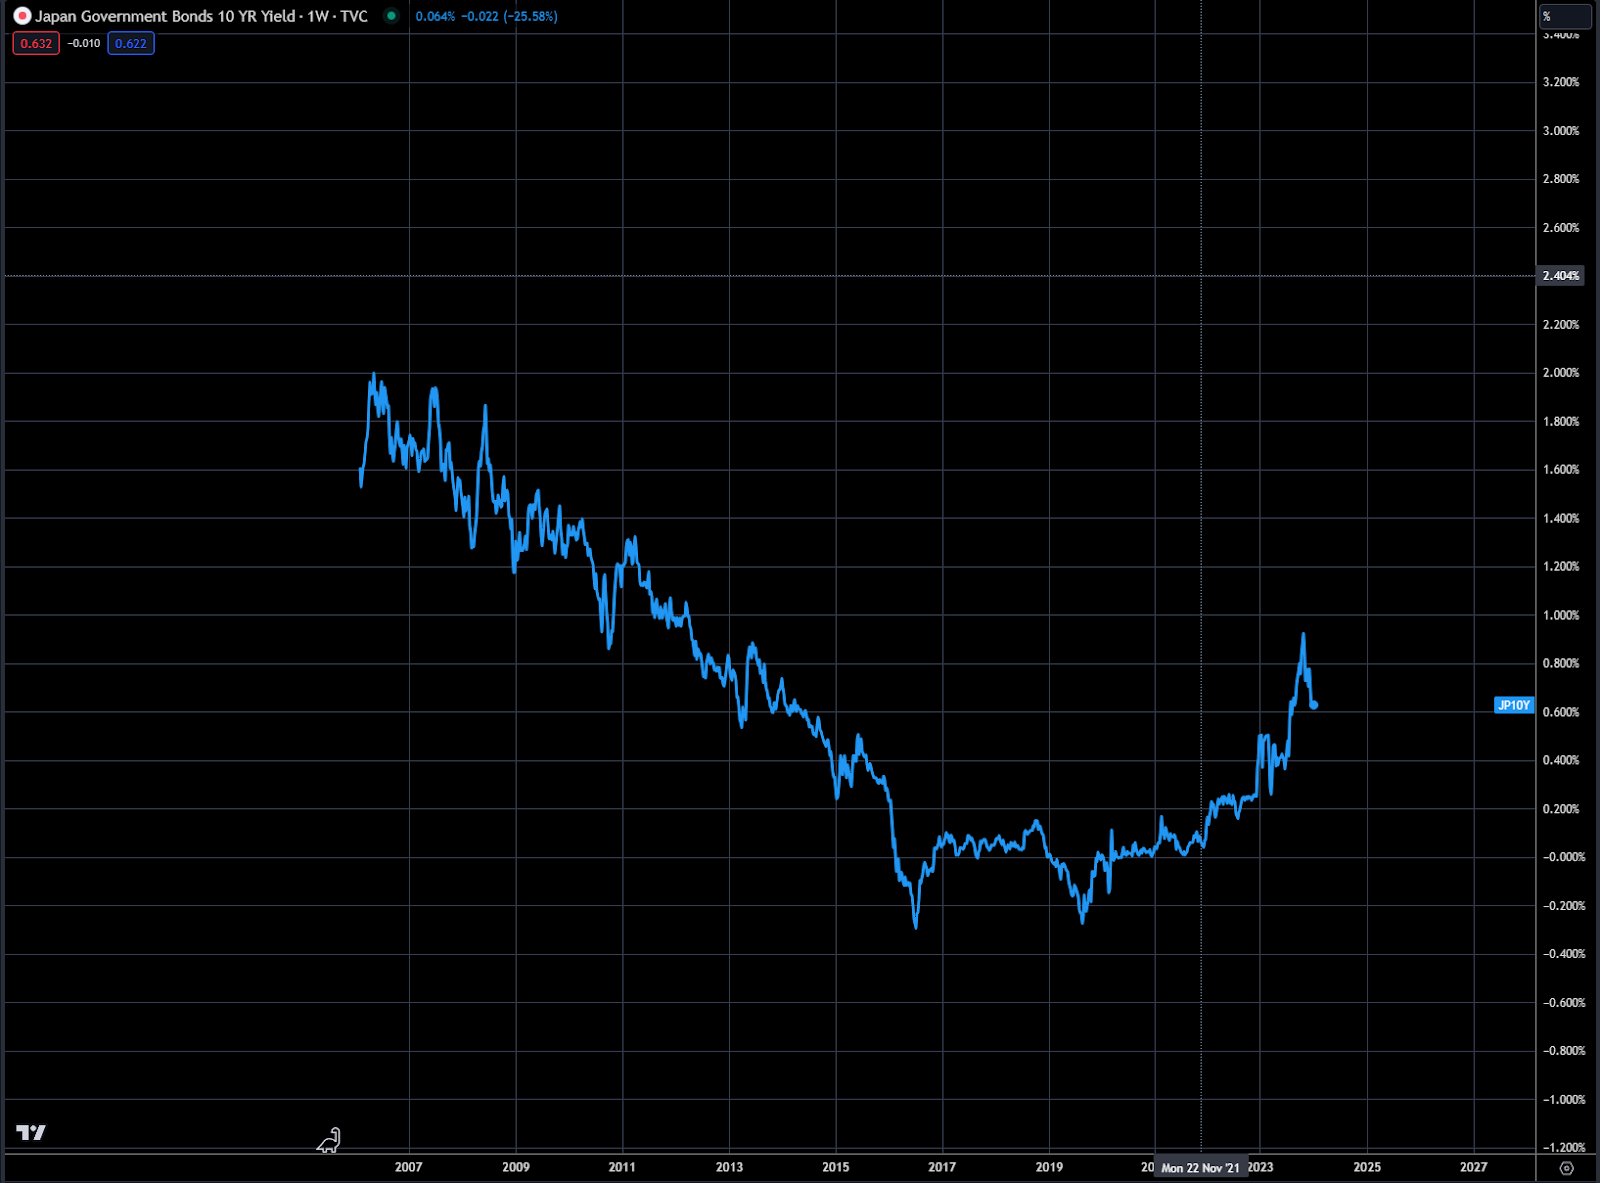
Chart 12 Chinese 10-yr rate