A Look at Forex
Author: Bruce Liegel
For most of my 30+ years in trading I have heard that the demise of the US dollar is coming and with it the end of its reserve-currency status. It doesn’t matter the time frame, there is always someone who makes what appears to be a strong argument as to why the dollar is ready to collapse - only to be proven wrong over time.
Currency markets are a different breed when it comes to trading, as there are so many variables that impact both the short- and long-term price outlook. Rarely today do you find any FX-centric funds left, as most have lost most of their assets because of non-performance. In a world of global zero interest rates, it became very difficult to make money trading just a FX portfolio.
I know this first hand, as I was a senior portfolio manager for a billion-dollar hedge fund whose focus was FX and interest-rate carry strategy from 2003-2010. You can see in Chart 1 below how successful FX carry strategies were from 2000-2008, and then really nothing for the next 10 years.
Chart 1
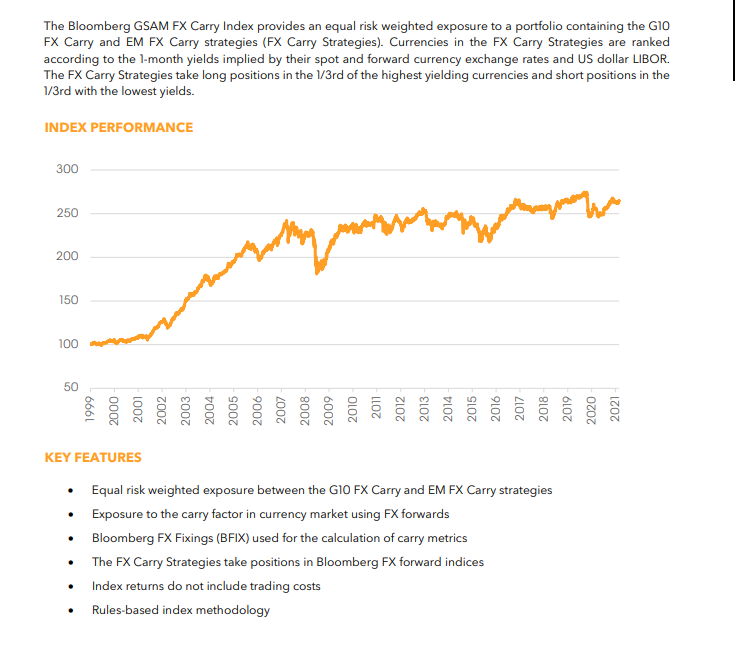
Times are changing again in the world of FX, as we all know that interest rates have been normalizing again - by this I mean that the market is setting rates again. I talked about this changing environment in my deep dive “The Carry in the Conundrum” earlier this year.
Rising interest rates will impact economies differently, and those with excessive leverage will be penalized worse than those that are not. We are already seeing this in certain bank balance sheets, real estate and others, but this will also become quite prevalent in the years ahead for individual countries.
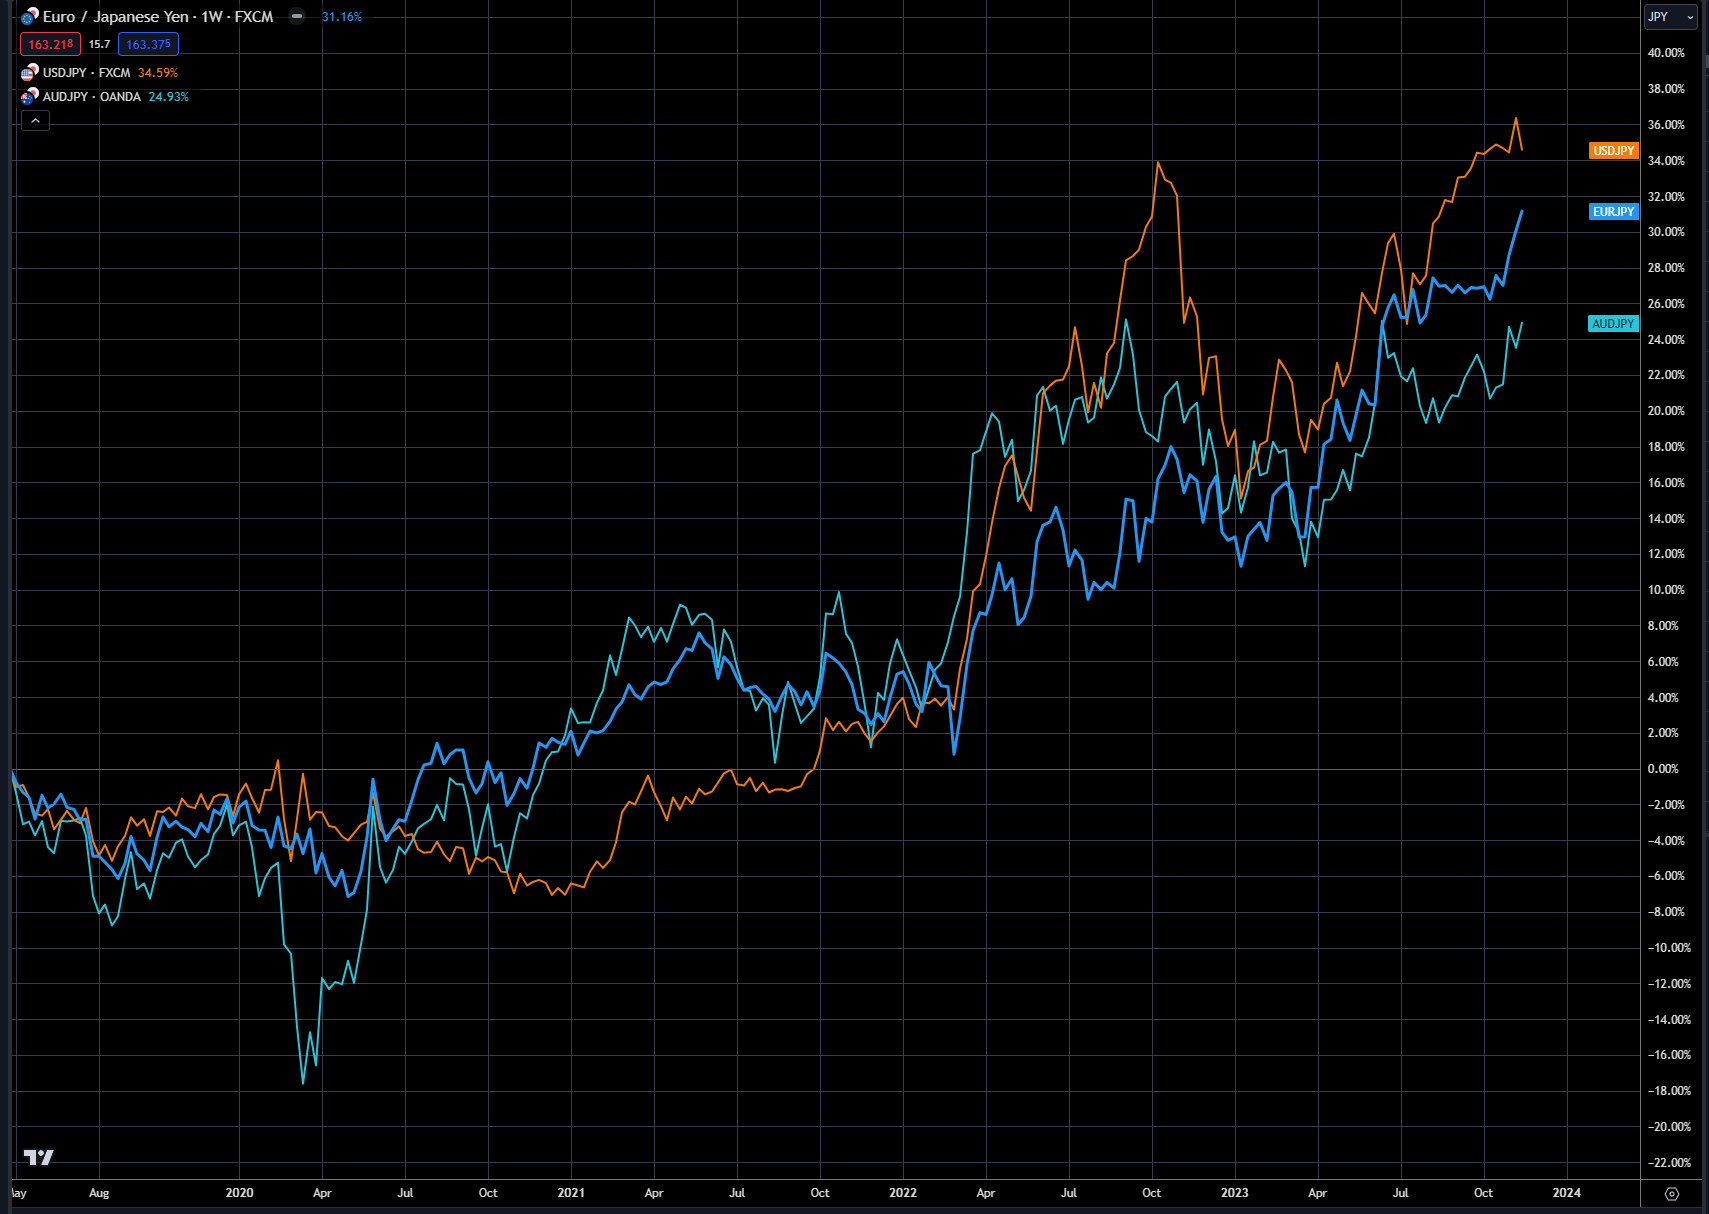
The yen has been the obvious trade for the past three years, as the Bank of Japan has kept rates pegged near zero. Chart 2 shows the carry trade for the USD verse yen in orange, the euro versus yen in blue and the Aussie dollar versus the yen in green since central banks began tightening after 2020.
Chart 2: FX carry trades - USD, euro and Aussie dollar versus the Japanese yen
The Bank of Japan is now beginning the process of normalizing interest rates, which is potentially putting in a top for its currency near the 150-level versus the USD. You can see this normalization via Chart 3, which shows the 2yr interest-rate spreads between the US, Germany and Australia versus Japan.
The blue line is the US 2yr-Japan 2yr, the green line is the Australian 2yr-Japan 2yr, and the orange line is German 2yr-Japan 2yr. I use the German 2yr as it is the pseudo rate for the ECB. Since 2020 this has been a great carry trade, but it is now getting near its end. It is a tough short though, as the US is still almost a 5% premium over Japan, Australia is over 4%, and Germany near 3% - meaning this would be a negative carry if you were to keep this trade on for a period of time. Negative carry means that if you held this trade for a year (selling the USD, euro or Aussie and buying the yen), the price of the FX cross would have to decline more than the interest-rate differential to make any money.
That doesn’t mean you can’t trade these tactically, and that would be the strategy over the short term until these central banks begin cutting rates, which would accelerate the decline. Once the Federal Reserve goes dovish and begins to cut, the USDJPY FX price will collapse - same for the ECB and RBA.
Chart 3: 2yr interest-rate differentials
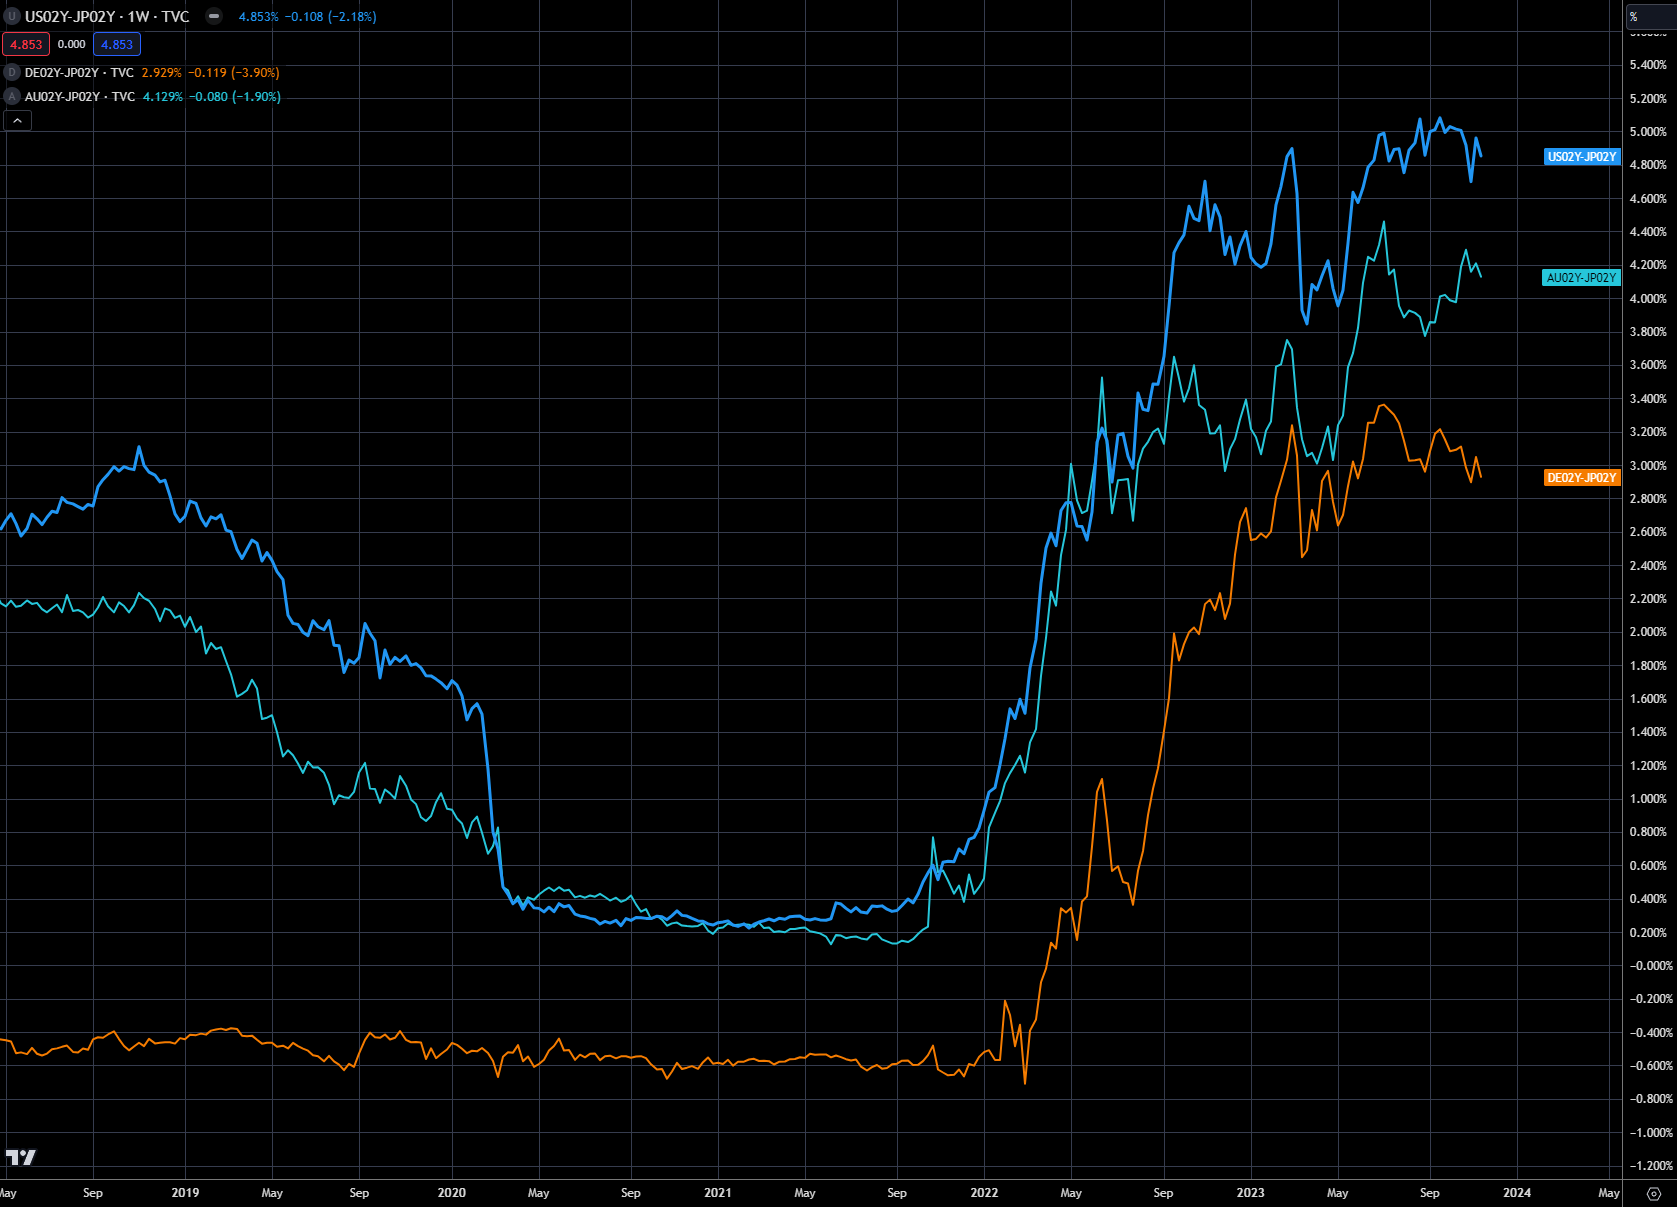
Chart 4 below shows just how correlated the USDJPY FX rate has been to the interest-rate differentials. The yen is overlayed in yellow below, and has moved in tandem with these differentials since the bottom in 2020.
Now that the BOJ has begun normalizing their interest rate policy, and other central banks appear to be near the end of their tightening cycle, there are opportunities in trading FX. This will also be the case between central banks, as policies will not be as intertwined as previously. Central banks will be more focused on individual country CPIs and other economic factors, which will drive interest-rate decisions.
Chart 4: 2yr interest-rate differentials with the yen in yellow
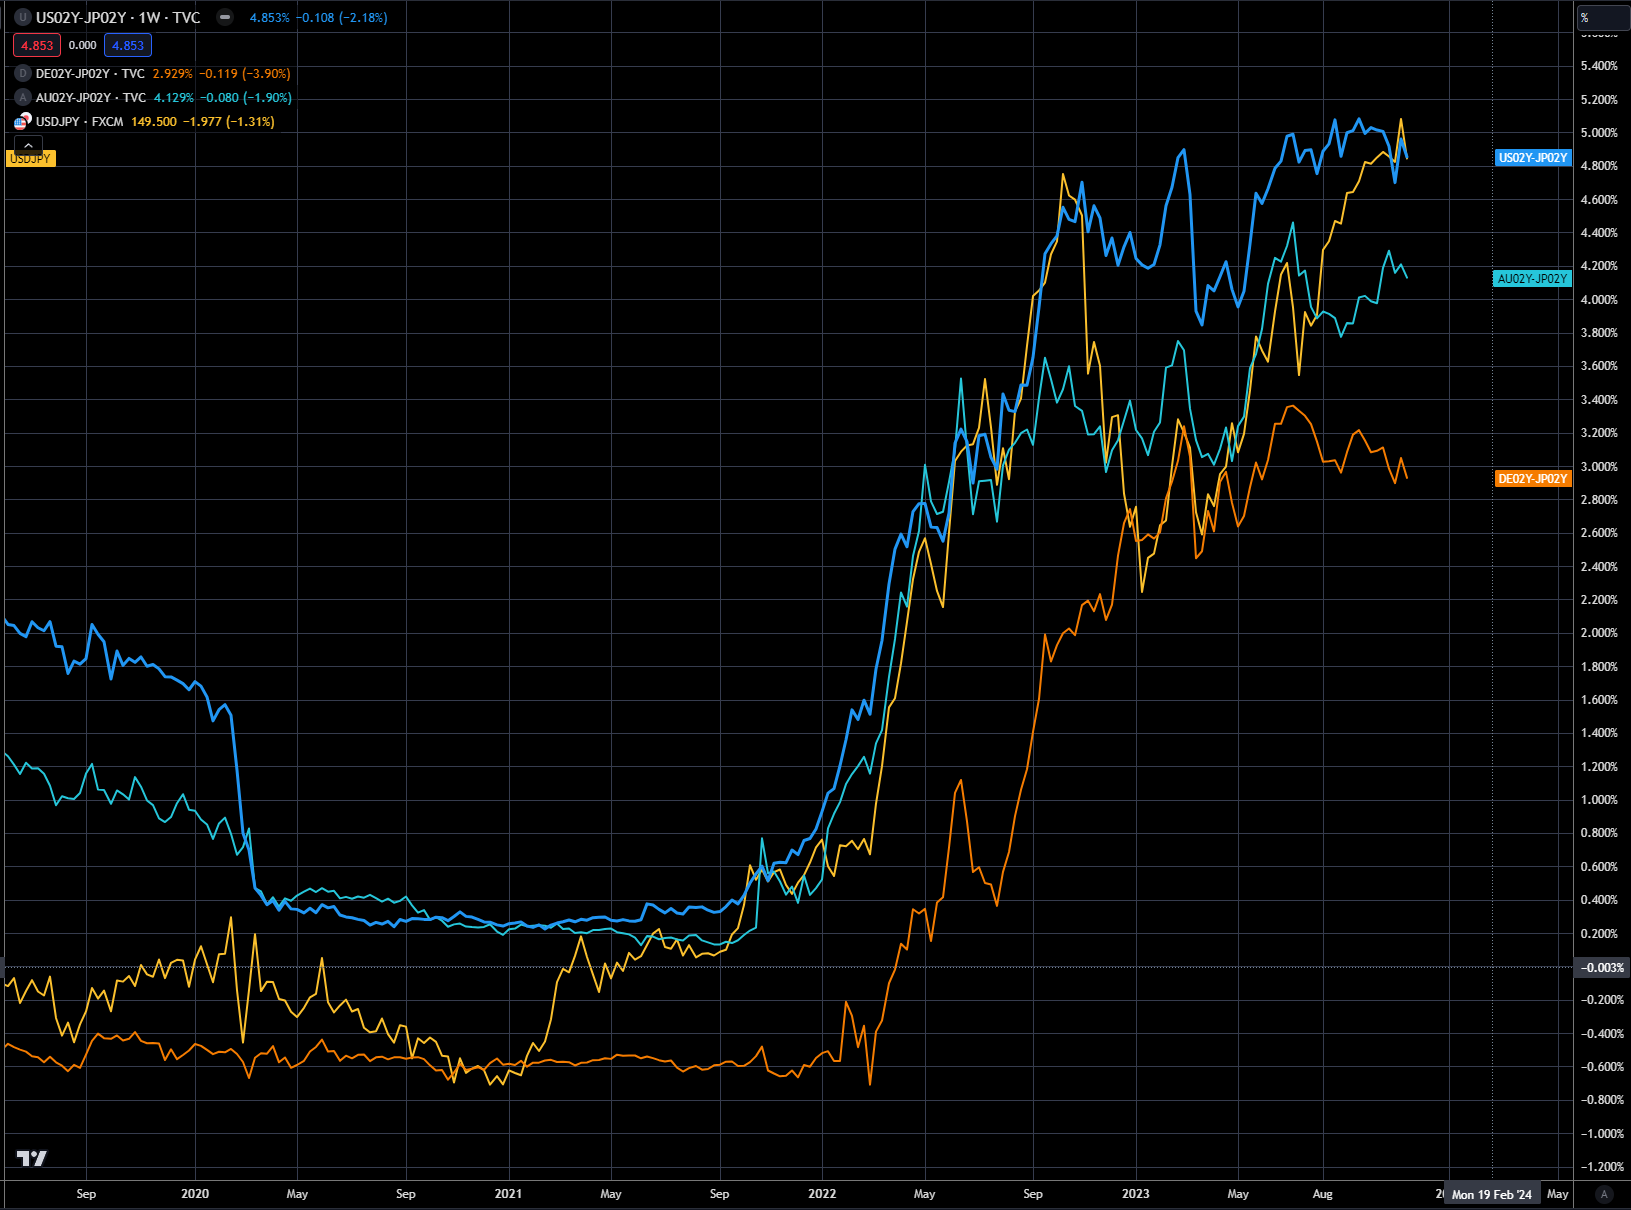
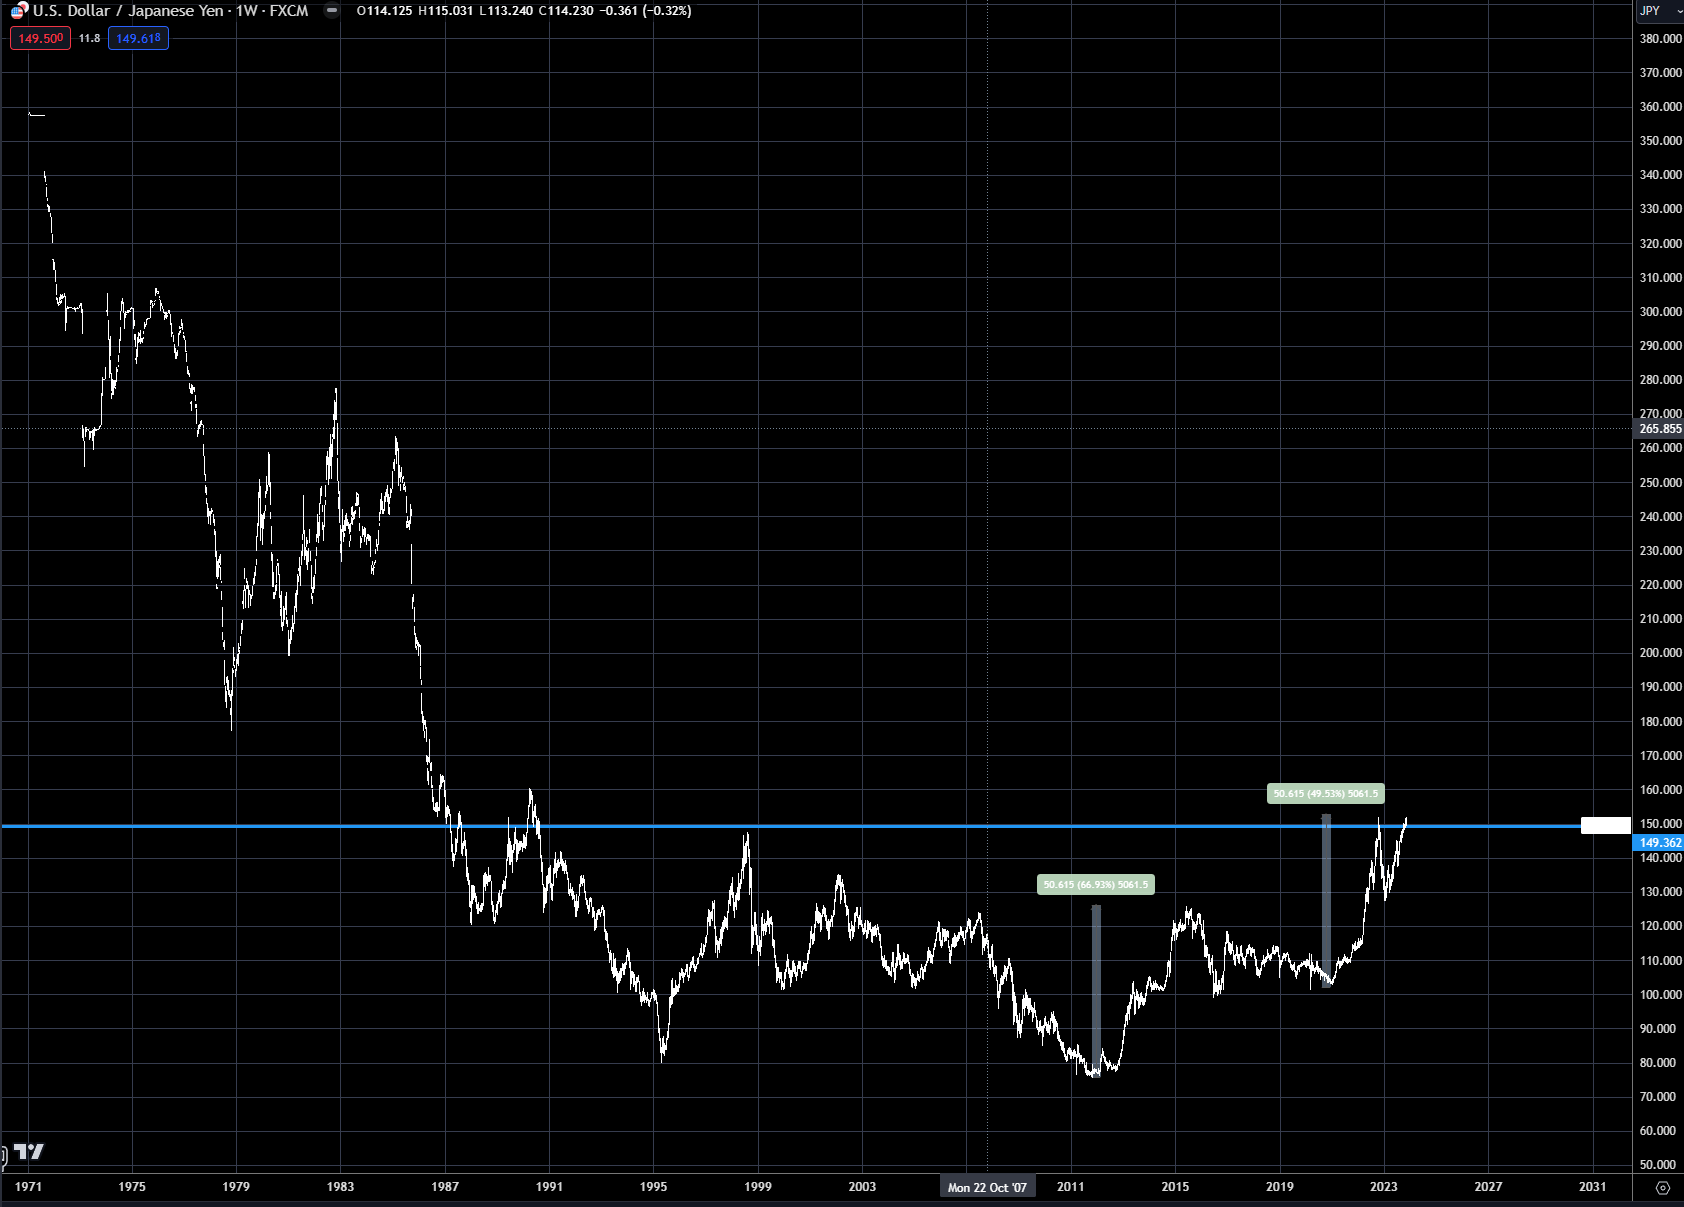
Chart 5 below shows the long-term price action of the USDJPY FX rate, with the blue horizontal line the key 150 level, which has capped the price level for over 30 years. With the current developing central bank policies, the 150 level should be the top for this interest rate cycle. Longer term, meaning a few years from now, the yen could depreciate much more. Only time will tell on this though.
Chart 5: Japanese yen
Dollar index
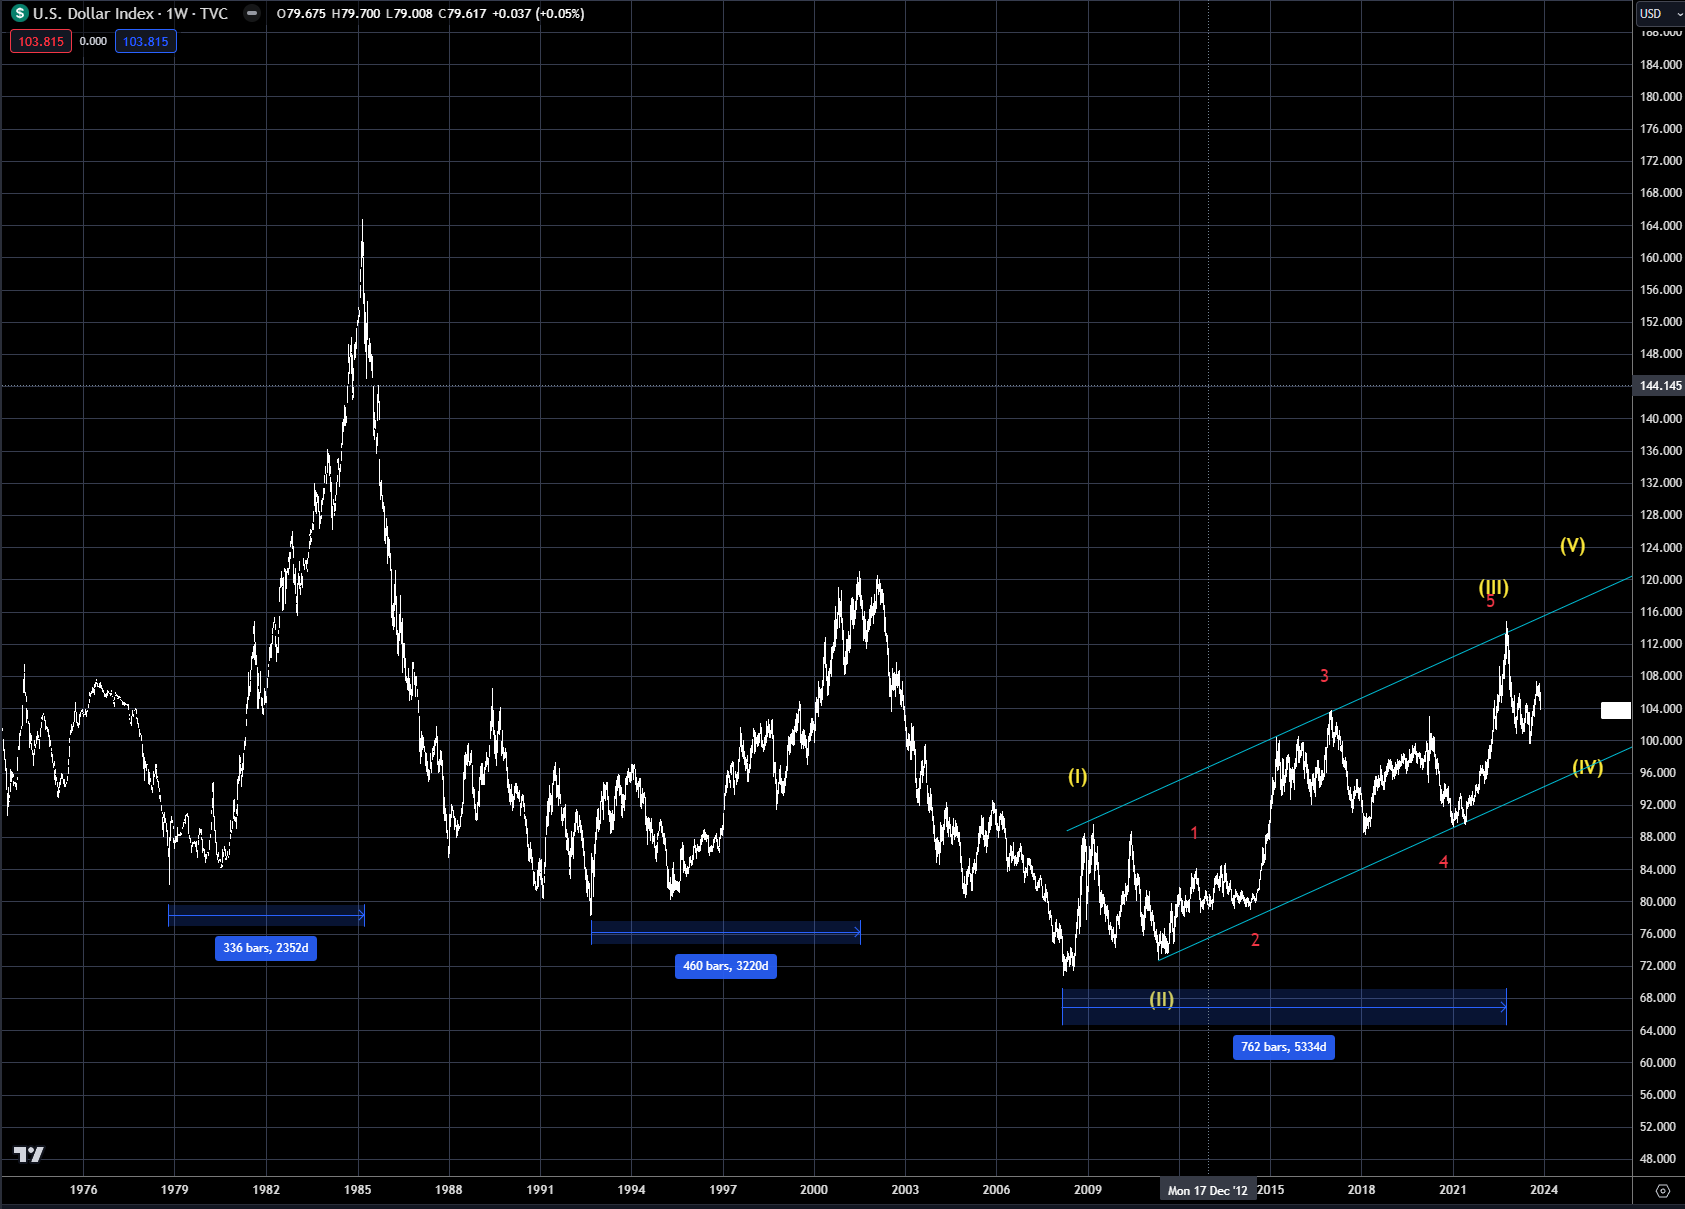
The dollar has been in its longest bull market since the change in FX policy via the Nixon Administration in 1971, ending the Bretton Woods fixed exchange rates. Chart 6 shows the data going back over 50 years, with three distinct dollar bull markets. The first was 1979-1985, the second was 1992-2002, and the current one began in 2008. These periods are marked by length via the blue bars on the bottom of the graph. This grind higher in the USD also corresponds with the rise of the Nasdaq index as it has attracted global fund flows.
The current grind higher continues to trade inside a very wide channel. Until this channel is broken, there is a strong argument that the dollar will continue to trend higher. That doesn’t mean the dollar trades sideways for an extended period, prior to the final wave V.
Chart 6: DXY index
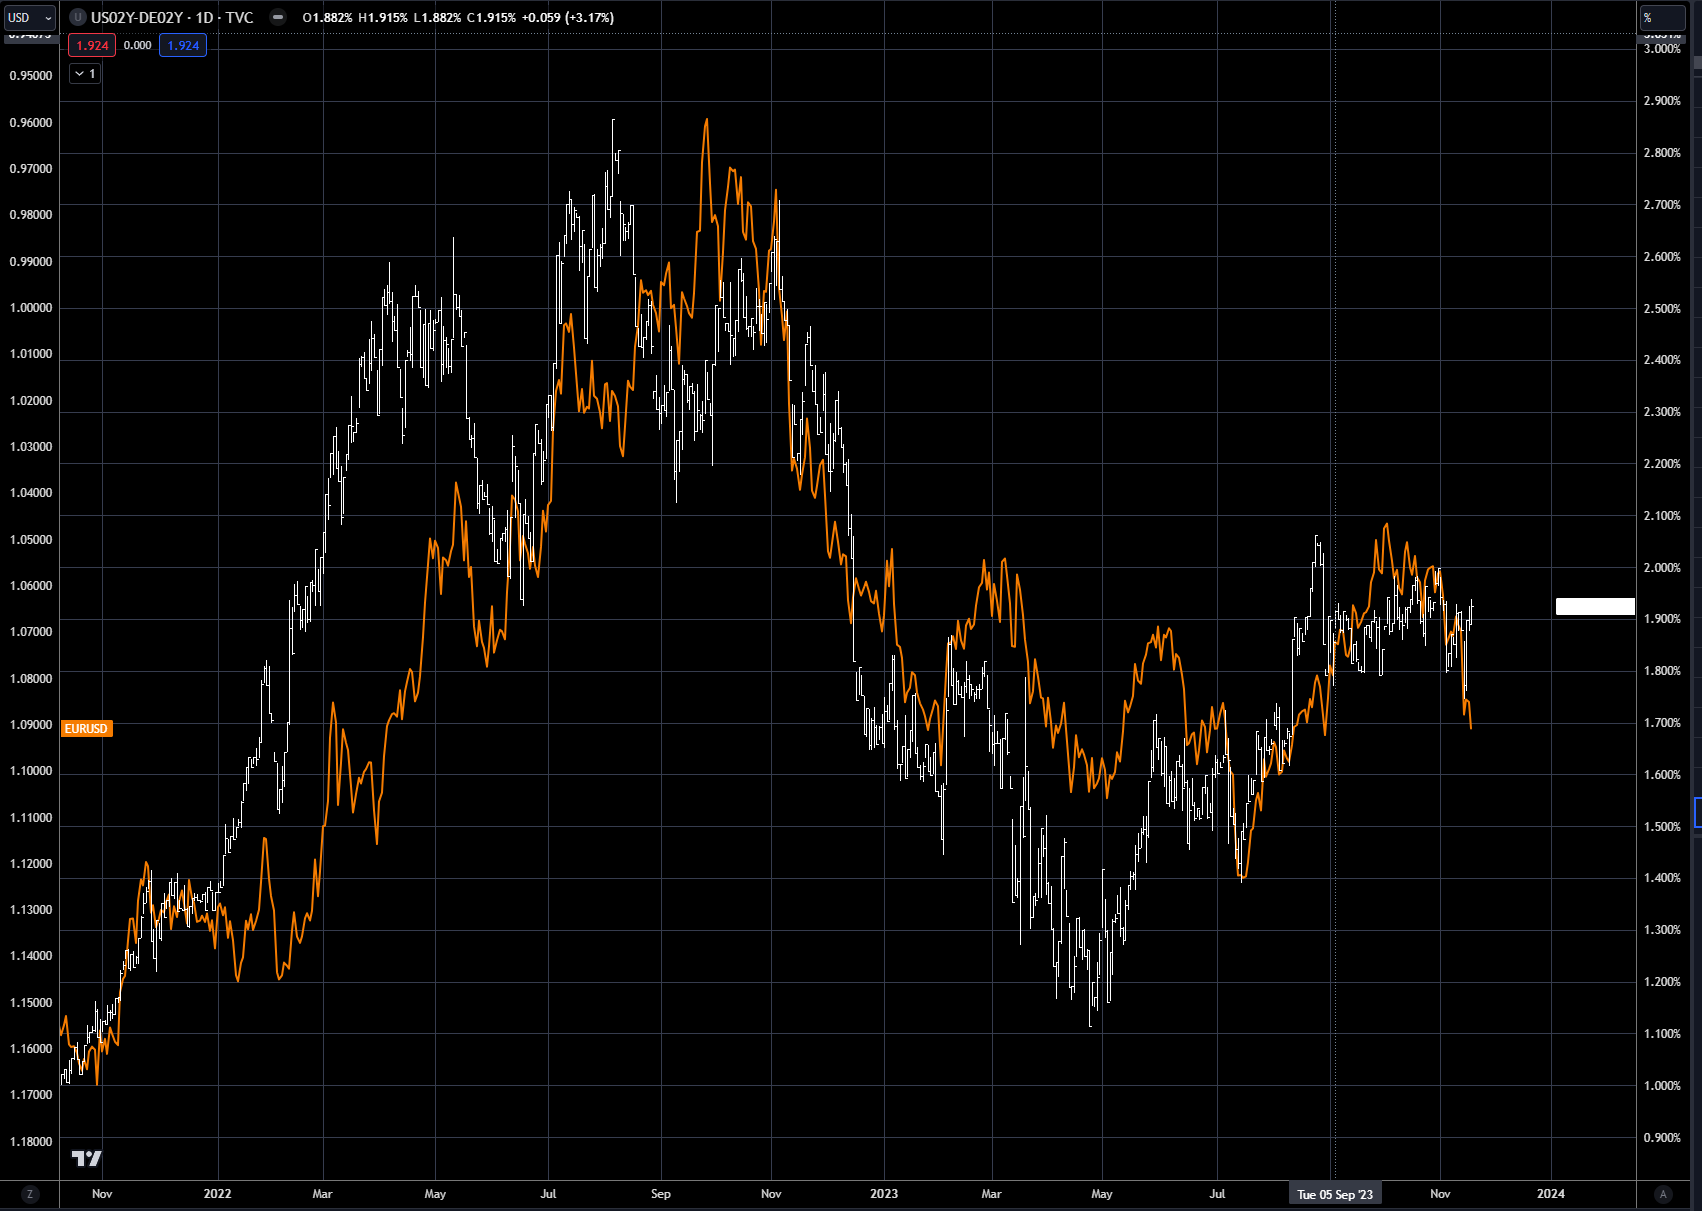
Digging into more short-term signals, the euro continues to follow the US 2yr minus the German 2yr differential rate - see chart 7. The euro is highly dependent on the direction of central bank policy between the Federal Reserve and ECB - which makes central bank meetings even more volatile. A dovish or hawkish comment from either central bank will really move the market.
Both central banks are close to completing this tightening cycle, and are keeping their policies pretty close - it's unlikely that either central bank will make a divergence policy change without the other. This pretty much puts the euro in a trading range for the foreseeable future, i.e., very technical. In the short term, 1.10 should be the top resistance with 1.05 the bottom support.
Chart 7: Euro FX ( in yellow inverted LHS) versus US 2yr-German 2yr RHS
Trading strategy is based on the author's views and analysis as of the date of first publication. From time to time the author's views may change due to new information or evolving market conditions. Any major updates to the author's views will be published separately in the author's weekly commentary or a new deep dive.
This content is for educational purposes only and is NOT financial advice. Before acting on any information you must consult with your financial advisor.