Risk-on Sentiment Prevails, Oil Slump Continues, and Gold Soars
Author: Bruce Liegel
Equities
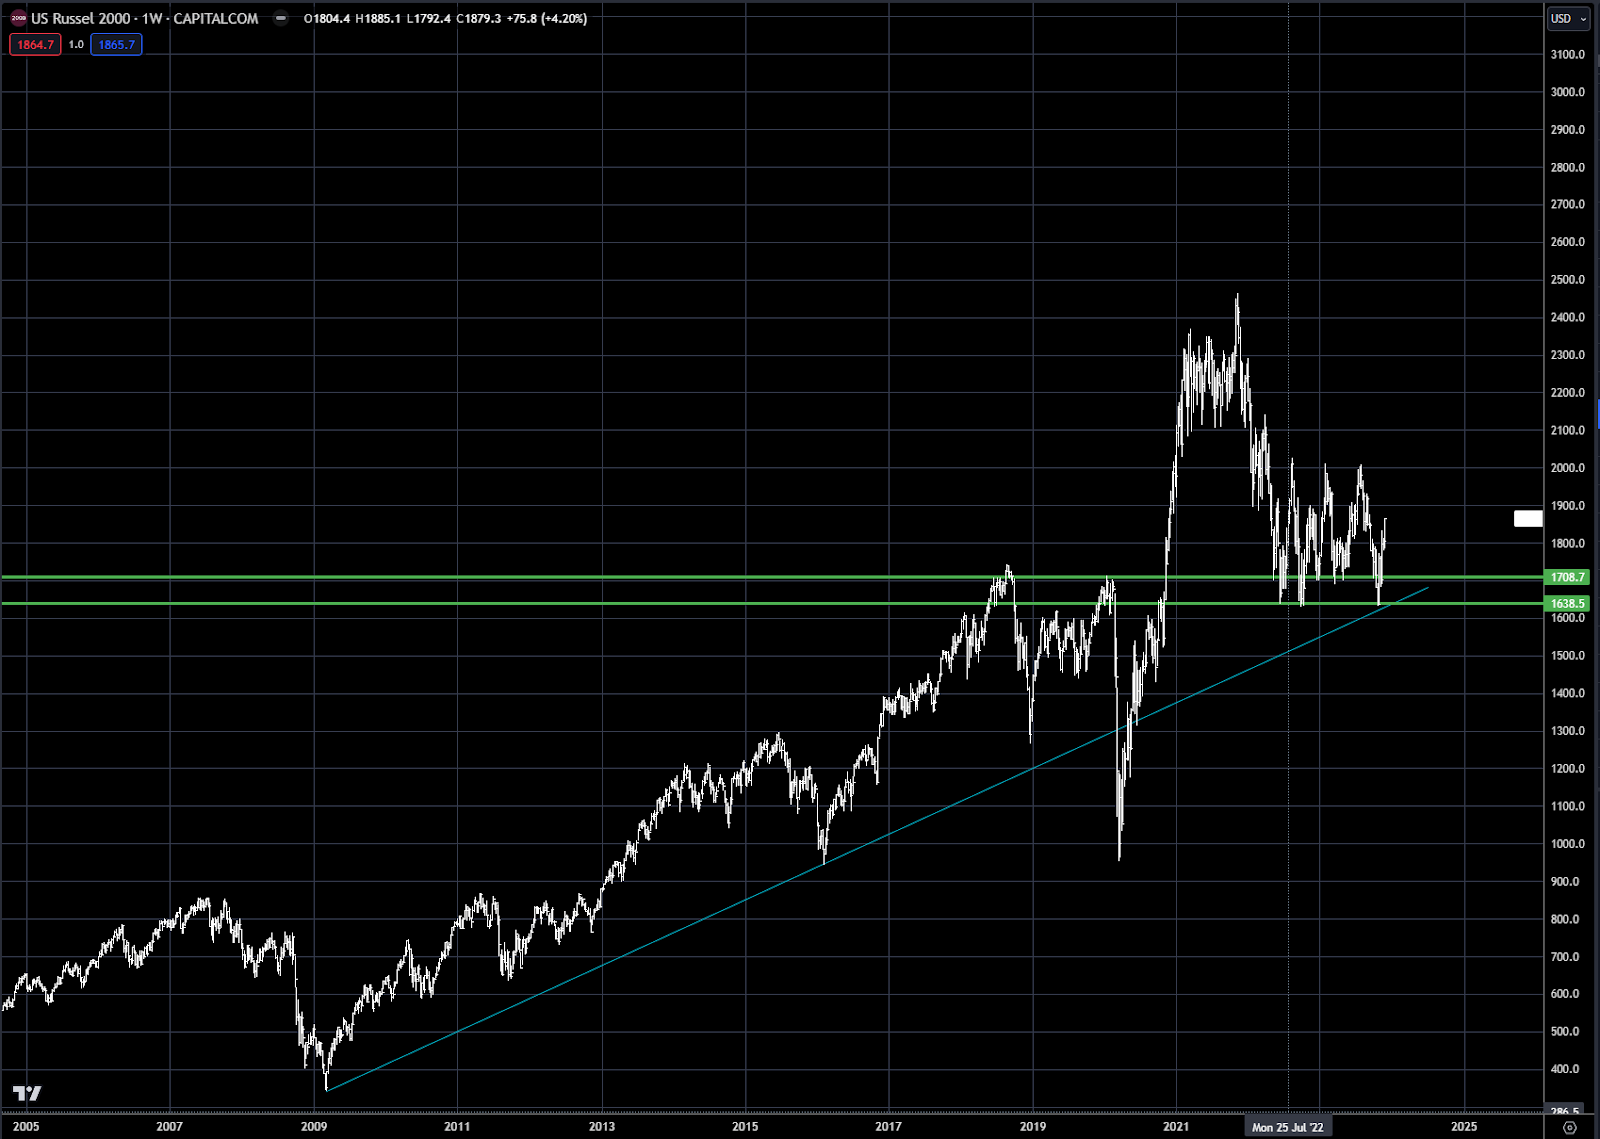
Fed Chairman Powell delivered an early Christmas present to the market on Friday when he pretty much laid out the end of this tightening cycle. "Risk-on" was the day’s theme, with the Russell 2000 closing up over 3% on the day. The S&P500 was up 0.5% while the Nasdaq closed up 0.25%. It’s clear from Friday’s action that rebalancing to the riskier Russell 2000 stocks is the trade for the rest of the year. We laid this scenario out in our Oct 30 update — pointing out that the Russell 2000 was right at major support (see Chart 1). The other factor mentioned was that Russell stocks would benefit from the start of the easing cycle — as they are more leveraged via debt, which will improve their balance sheet with lower rates.
Chart 1: Russell 2000
Forex
The dollar also sold off against “risk-on” currencies with the Australian dollar up over 1% on Friday, and a number of EM currencies up over 1%. Mexican Peso up 1.25%. Brazilian Real up 0.95% to name a few.
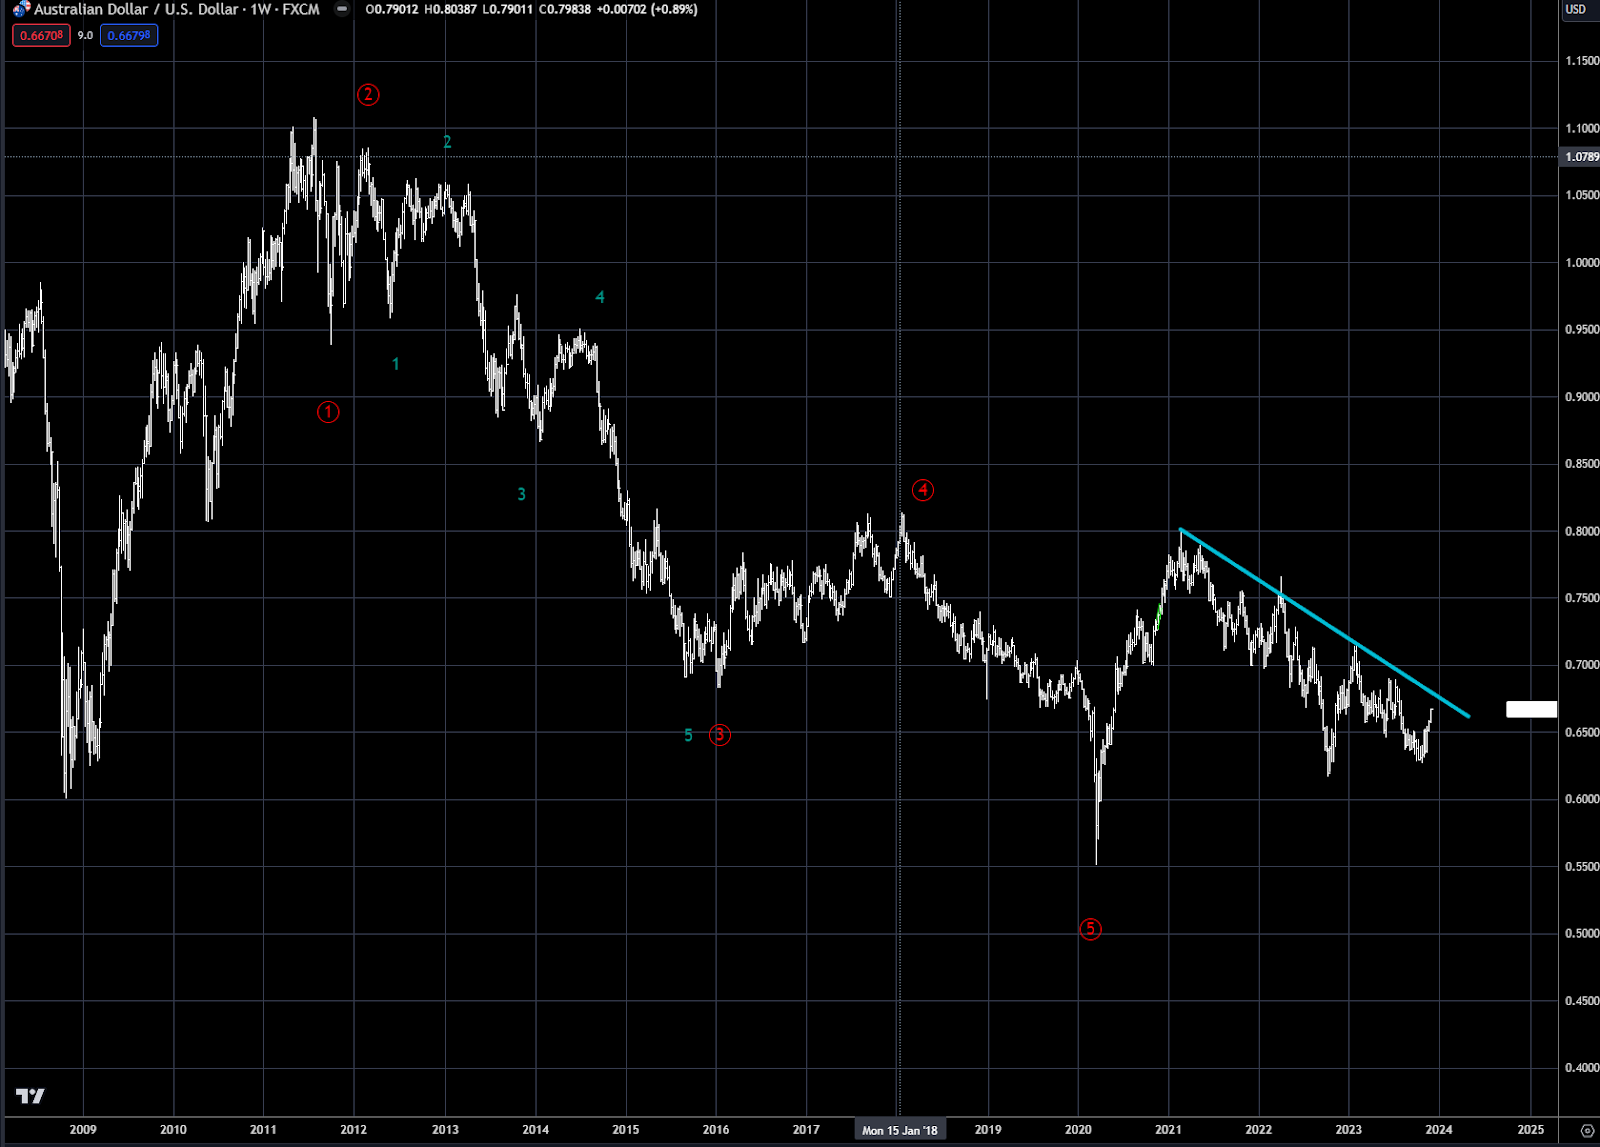
The Australian dollar has been in a bear market since 2011, but is showing signs of bottoming. The market has been testing the 60-cent level now and appears to be holding. The key will be if the down trend line from the 2021 is taken out. Any pullbacks over the next few weeks would be good areas to add positions.
Chart 2: Australian Dollar
In previous weekly updates, interest rate differentials have shown to be a valuable tool in looking at FX markets. Chart 3 is the 2yr differential between the US and Australia which has been trending higher since 2011 — US yields gaining on Australian yields. These trends or cycles can last years as the current one has been ongoing for over 12 years, but appears to be shifting.
Chart 3: US 2yr rate- Australian 2yr rate

The RBA meets again this week, and market expectations are for a pause, after hiking 25 bps in November. This meeting will be critical in determining future interest rate policy for 2024
The chart below shows the overlay of the Australian dollar (LHS in Orange) and the interest rate differential (RHS in white). Clearly, an easing cycle led by the US Federal Reserve would be quite beneficial to the Australian dollar.
Chart 4: Australian Dollar in Orange (LHS Inverted) and US-AUD 2yr rate Differential (RHS in White)
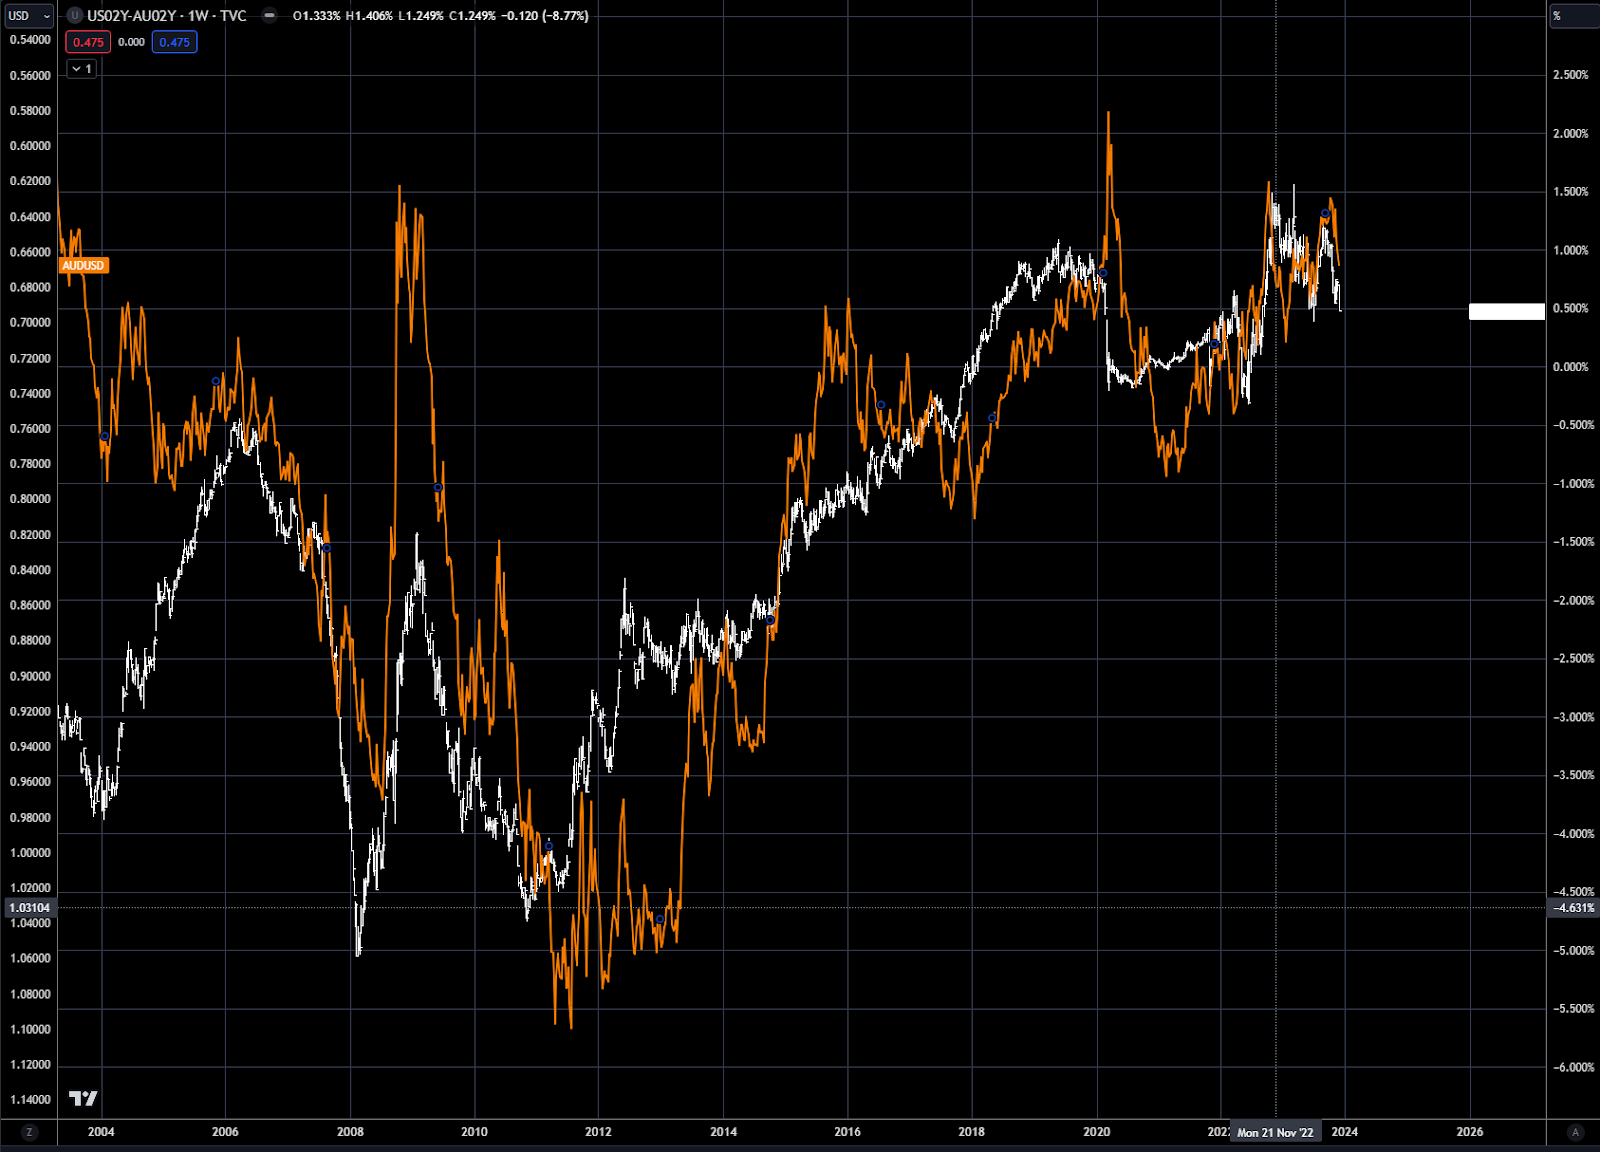
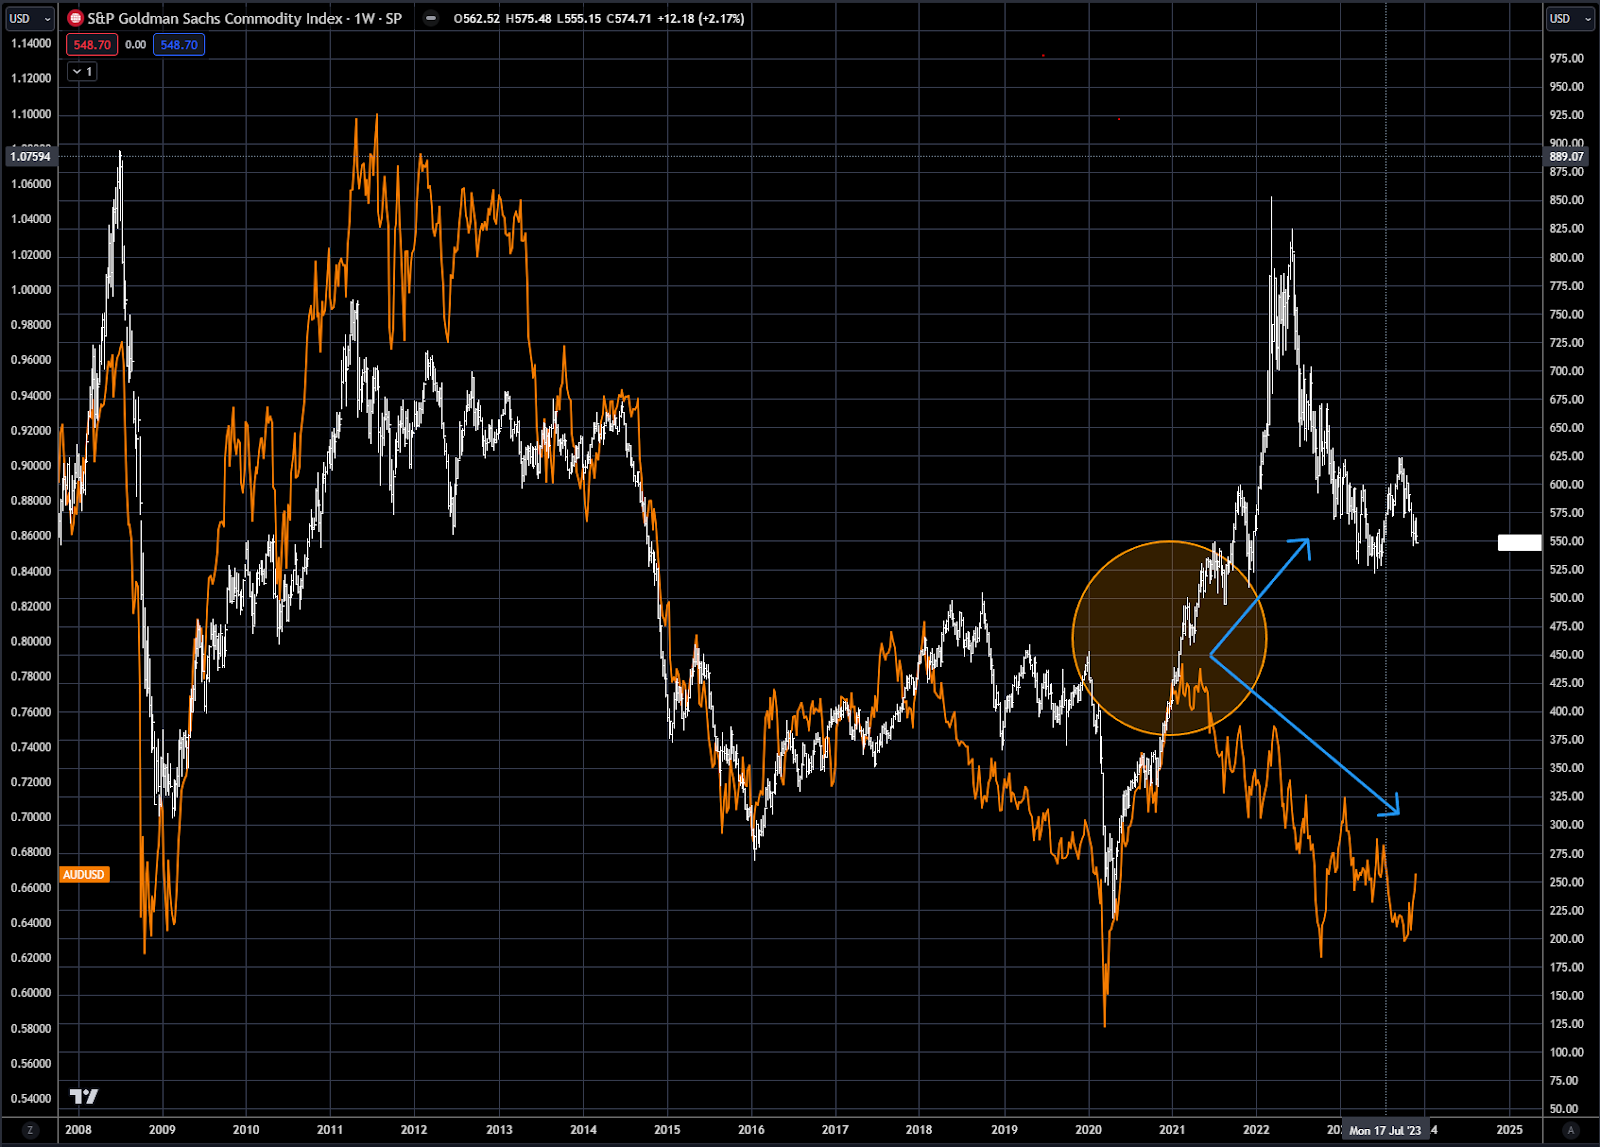
Chart 5 shows the overlay of the Australian dollar against the S&P GSCI commodity index. The pair have been highly correlated over the past 25 years, but there has been clear divergence since 2021. You can see the divergence marked by the circle and blue arrows. Mean reversion would suggest that the two work back towards neutrality, which could be a combination of weaker commodities and stronger Aussie dollar.
The Aussie dollar is cheap versus the basket of commodities — and this could also help drive the FX price higher over the next year.
Chart 5: Australian Dollar in Orange (LHS) vs S&P GSCI Commodity Index (RHS in White)
Rates
Friday’s comments from the Fed Chair may have also confirmed the high for this interest rate cycle. Friday’s breakdown in the 10-yr indicates that 5% may have been the top of wave V that has been discussed for a few months. Remember though, our long-term forecast is for higher rates over the long term – indicating that a pullback in rates should last 1-2 years before they begin climbing again.
The Fed chairman did indicate that higher for longer is still possible, which makes a counter rally from last week's low a good possibility, and an area where positioning opportunities will be available.
Chart 6: US 10-yr Interest Rate

Gold
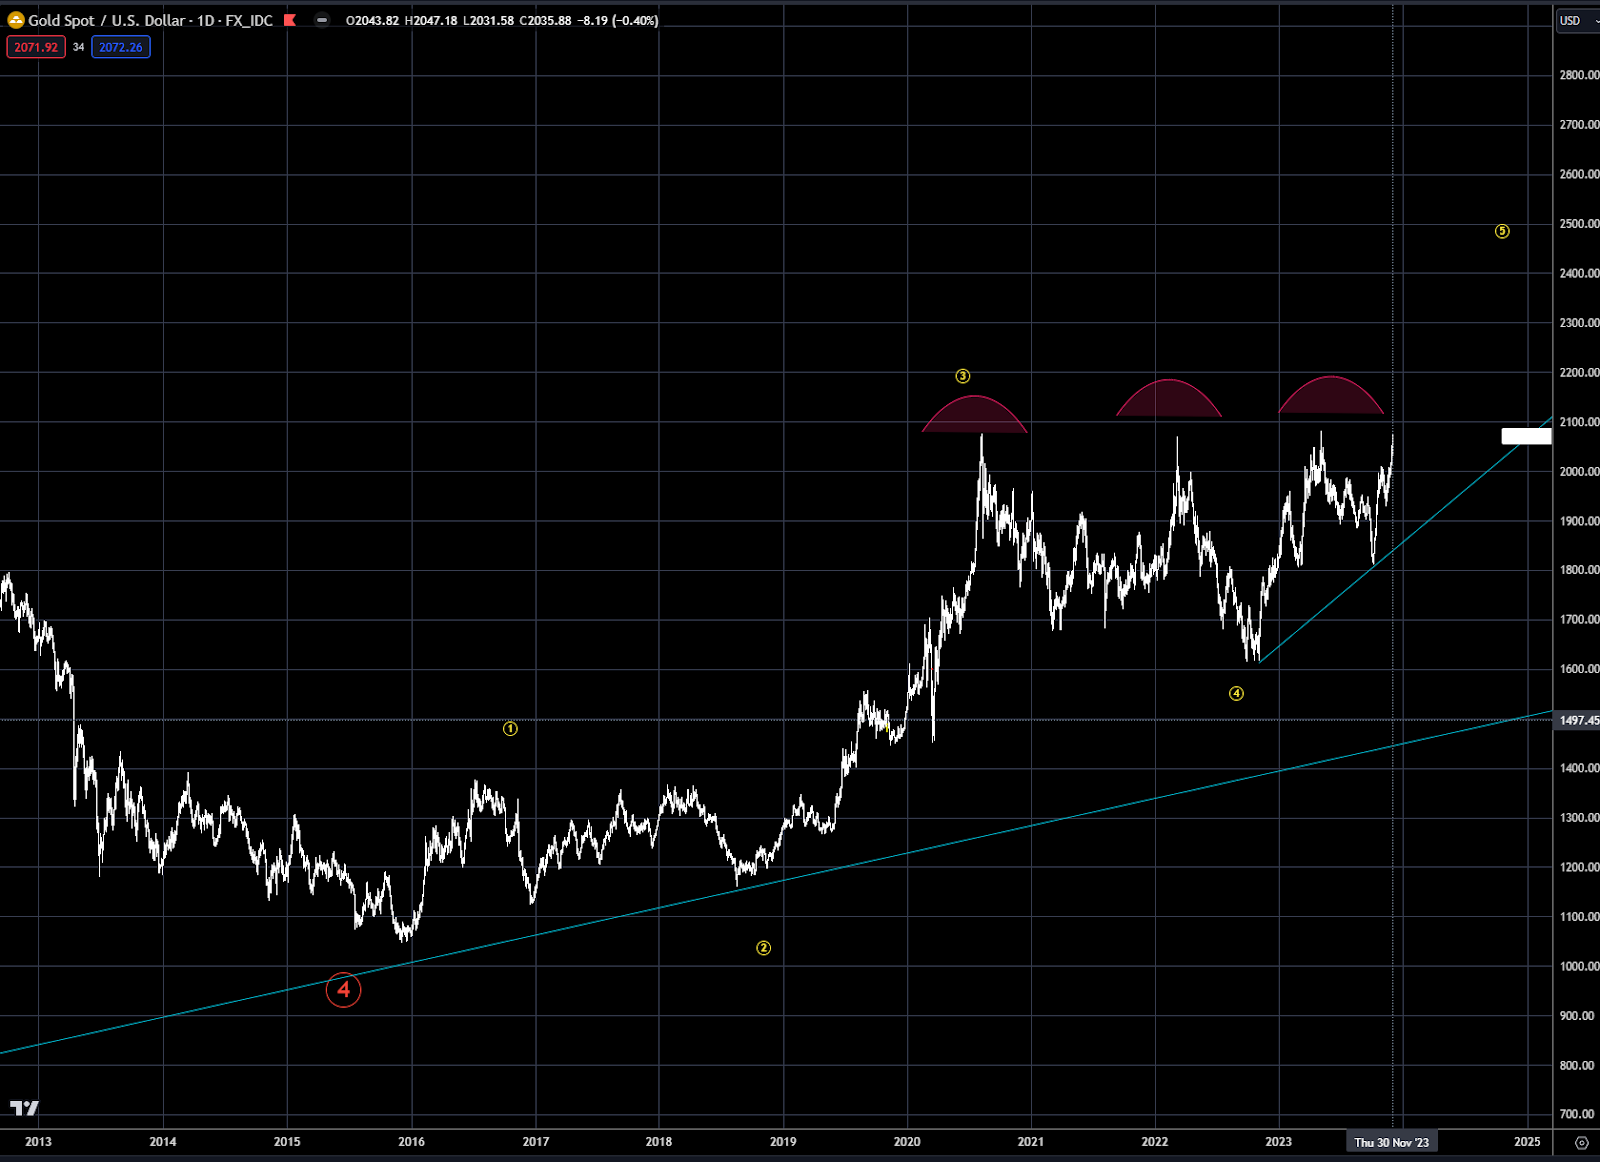
Gold continued to rally last week, surging on the dovish Fed comments to close near the old time high. Since 2020 gold has traded in a very wide range of $1700-$2100. Markets rarely have “4” tops near the same price range as shown in Chart 7. So odds continue to argue for a breakout to the upside. Gold continues to outpace gold equities, as argued in our gold deep dive. Institutions still want the pure hedge and are pretty much ignoring the mining companies and buying gold ETF exposure.
Chart 7 Gold Spot
Crude Oil
By all measures the OPEC meeting last week was a failure for supporting the market. After rallying initially on the announcement, the oil market reversed and closed down over $2 on Thursday and then fell another $1 on Friday. This is now setting up the stage for the culmination mover lower—which may take the next 1-3 months. Chart 8 shows the cash price, WTI since the high last year near $125. It has been my experience these price spikes encourage supply, which generally take 1-2 years to work off.
The summer rally failed at a key juncture – 50% retracement (green horizontal line) from the 2022 high and also where the trendline from the high ( blue line) intersected with price. The market is now in a clear 5 wave pattern from this intersection, with more downside to come. The downside target should be near $65 per barrel. This will also complete a larger 5 wave down pattern (labeled in green) from the 2022 high.
You can really see the bearish fundamentals in oil by focusing on the forward curve, which has collapsed since September. Chart 9 shows the January 2024-June 2024 price spread. The front end of the market has fallen over $6 a barrel since September, indicating a very oversupplied market.
Chart 8 WTI Crude Oil Cash Price

Chart 9 January 2024 NYMEX Crude Oil - June 2024 NYMEX Crude Oil

Trading strategy is based on the author's views and analysis as of the date of first publication. From time to time the author's views may change due to new information or evolving market conditions. Any major updates to the author's views will be published separately in the author's weekly commentary or a new deep dive.
This content is for educational purposes only and is NOT financial advice. Before acting on any information you must consult with your financial advisor.